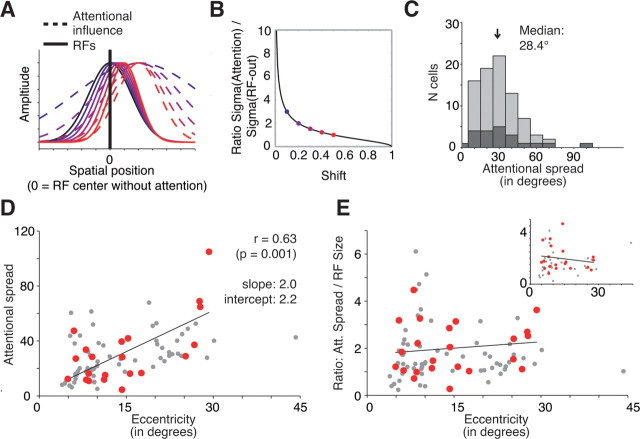
Figure 5.
Model prediction and estimation of attentional spread underlying the observed shift and shrinkage of neuronal receptive fields. A, Given a fixed spatial center of attention, the model estimates a narrower attentional spread (blue to red, dashed Gaussians) and the stronger the receptive field is shifted toward the attentional focus (blue to red, solid Gaussians). B, Relationship between the expected RF shrinkage (when attention is shifted into the RF) as a function of the observed RF shift (Eq. 8, see Materials and Methods). C, Distribution of the attentional spread (full width) estimated based on the observed RF shifts. Dark/light gray bars represent the data from the selected/all RF pairs as in Figures 2–4. D, Scatter plot showing that the estimated attentional spread (y-axis) grows with an increasing eccentricity of the attentional focus (x-axis). The best-fitting linear regression has the form width of attentional spread, 2.0 × eccentricity + 2.2. Red dots represent the data from selected RF pairs, and gray dots represent the data from all RF pairs as in Figures 2–4. E, Same format as in D, but showing the lack of correlation between the ratio of attentional spreads to RF size with eccentricity of the neuron's RF.

