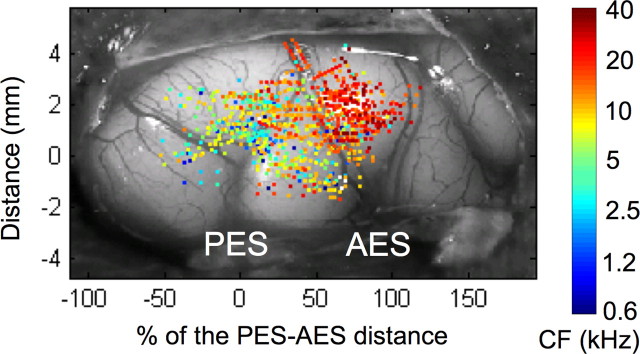
Figure 1.
Spatial distribution of cortical recording sites in the 30 normal-hearing cats superimposed on a typical view of auditory cortex. For each cat, the distance between the tips of the anterior ectosylvian sulcus (AES) and the posterior ectosylvian sulcus (PES) was normalized to 100%. The y-axis represents the distance (in millimeters) in the ventro-dorsal direction from the tip of the PES. The colors of dots indicate the characteristic frequency of neurons.

