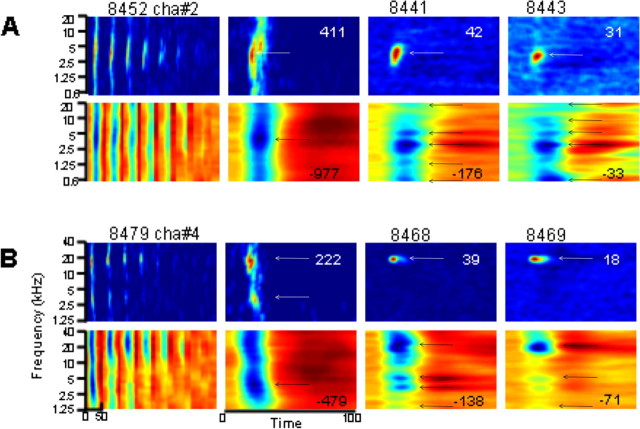
Figure 2.
Examples of STRF obtained from LFPs (second and fourth rows) and MUA (first and third rows) from two electrodes (recordings were not simultaneous). The tuning curves are shown in the first column; responses over a 50 ms window (from stimulus onset) obtained with intensity levels between −5 (right) and 65 dB SPL (left) are stacked. The second column shows the STRF derived from the STS condition at the same level used for deriving STRF from MTS, namely at 65 dB SPL. The third and fourth columns show the STRFs derived from MTS_20 and MTS_120, respectively. Numbers within each panel (columns 2–4) indicate the maximum firing rate (for MUA, first and third rows) and the negative peak amplitude (for LFPs, second and fourth rows). For MUA (first and third rows), the color scale indicates the firing rate, from dark blue (minimal responses, corresponding to spontaneous firing rate) to dark red (maximal responses). For LFPs (second and fourth rows), the color indicates the amplitude of the potentials, from dark blue (negative potentials, which correspond to excitatory synaptic potentials; see Results, Individual examples) to dark red (positive potentials). Black arrows indicate peak frequencies detected by the algorithm (see Materials and Methods).

