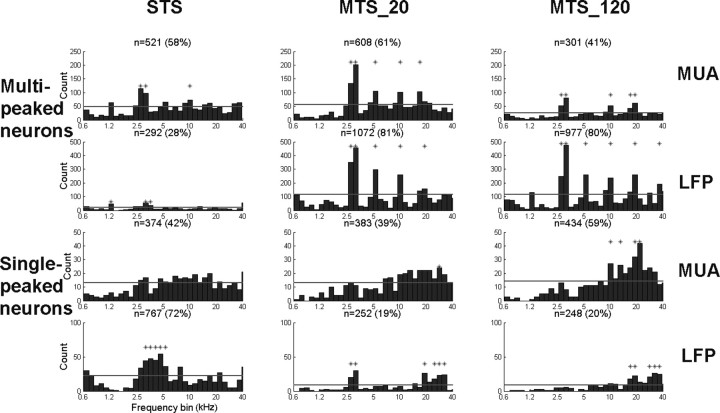
Figure 8.
Histograms showing the distribution of BFs in multi-peaked (first and second rows) and single-peaked (third and fourth rows) neurons, for MUA (first and third rows) and LFPs (second and fourth row) for single-tone stimulation (first column), moderate-density multi-tone stimulation (second column), and high-density multi-tone stimulation (third column). An asterisk above histogram bars indicates a significant over-representation of the corresponding peak frequency (vs a uniform distribution, p < 0.0017; see Materials and Methods). The number and percentage of neurons are indicated above each panel.

