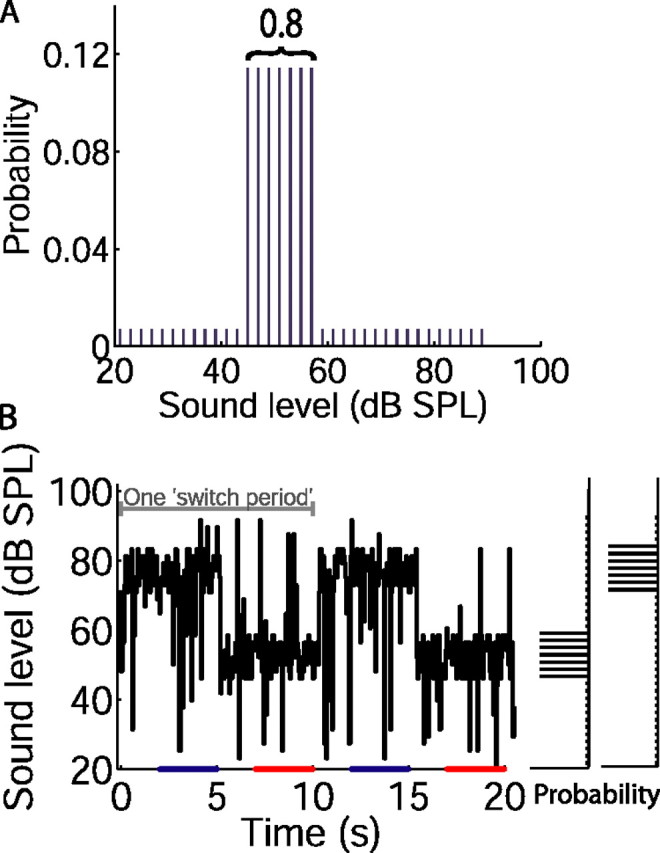
Figure 1.

Design of switching stimuli. A, Distribution of sound levels with high-probability region centered at 51 dB SPL (referred to as the “51 dB stimulus”). The value 0.8 refers to the probability of a sound level being drawn from the high probability region. B, Sound level over two 10 s switch periods, drawn from distributions shown to the right. Mean level changed every 5 s when the distribution switched between the 75 and 51 dB stimuli; the total range of levels presented remained the same. The bars on abscissa indicate sampling periods (repeated throughout stimulus) for plotting rate level functions from the final 3 s of each sound level distribution (as plotted in Figs. 2 and 4).
