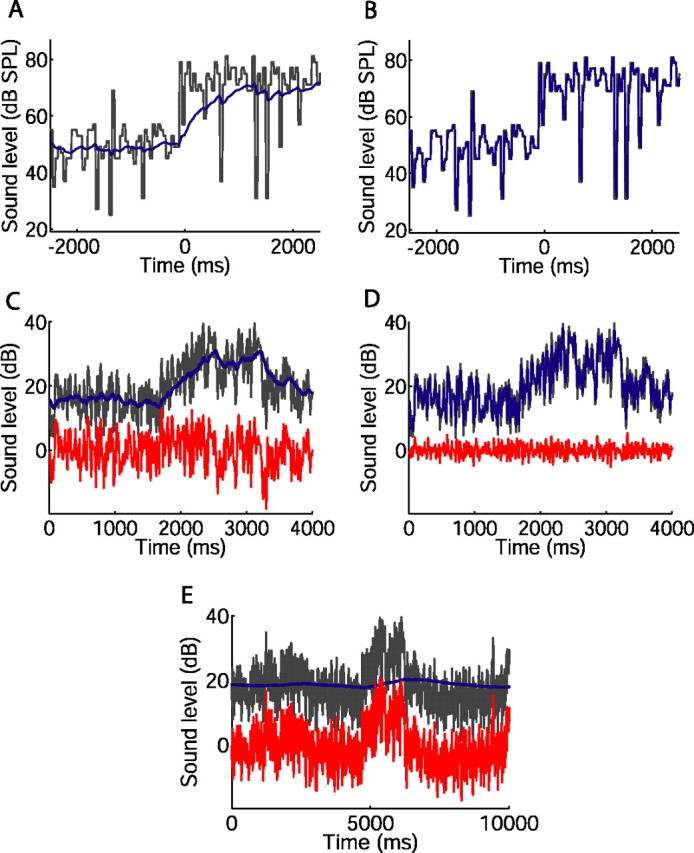
Figure 7.

Implications of adaptation time course, examined using an illustrative, linear model of neural memory. A, B, Sound level during a portion of the switching stimulus (black), with sound level distribution switching from 51 to 75 dB stimulus at t = 0 s. Blue, Sound levels averaged over the preceding, exponentially weighted memory window, with a time constant of 493 ms (A) or 17 ms (B). C–E, Variations in sound level in a rural environment (black), and sound levels averaged over memory window (blue). The red traces show the difference between the black and blue traces, representing, in this model, the input driving the neuron that remains after adaptation. C, Four second section of recording; 160 ms memory time constant. D, Same section of recording as in C; 15 ms memory time constant. E, Ten second section of recording; 5000 ms memory time constant.
