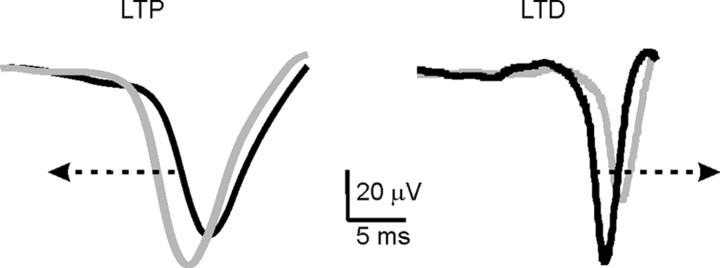
Figure 5.
T waveform shifts after TSS. The traces show the average T wave obtained by pooling sweeps from experiments showing either LTD (n = 5 in control) or LTP (n = 5 in the presence of gabazine) >8%. The black traces are taken before TSS, and the gray traces are taken 30 min after TSS. It should be noted that T delay from the tactile stimulus is reduced during LTP and increased during LTD (arrows).

