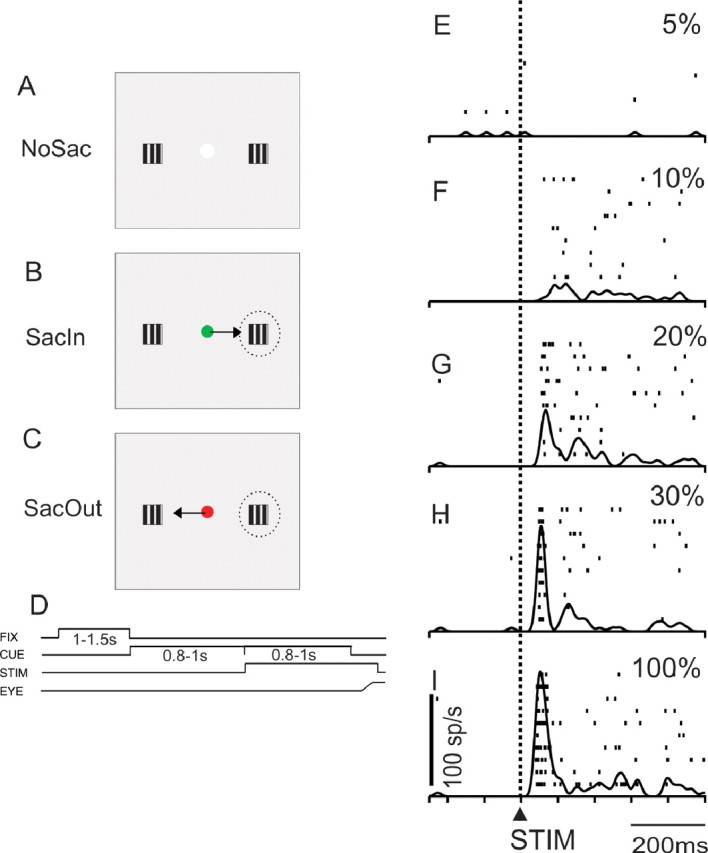
Figure 1.

SC neurons respond to luminance gratings. A, Spatial depiction of the three conditions of the task. The gray square indicates the display at which the monkeys looked. Each hemifield contained a square-wave grating with varying contrasts. The centrally located spot (white) was the fixation point. NoSac indicates that the monkeys were required to remain fixating for the duration of the trial. B, Same as in A for the SacIn condition in which the monkey made a saccade to the RF. The green fixation point was a cue for these trials, and the arrow indicates the saccade direction. Dashed ovals are schematics of the RF. C, Same as in A and B for the SacOut trials. A red central cue indicated that a saccade out of the RF would be required. D, Temporal arrangement of the task. Upward deflection in the line indicates that the stimulus was turned on. Downward deflections indicate the stimulus was turned off. FIX, Fixation point; CUE, color change in fixation point; STIM, appearance of contrast patches; EYE, schematic of the eye position requirement of the task. E–I, A single SC neuron recorded in the NoSac condition. The dashed vertical line and upward arrow labeled STIM on the bottom panel indicate the alignment of the traces on the onset of the contrast patches. Each panel is taken from a set of trials for each contrast. The contrast relative to background is indicated as a percentage for each panel. Each tick is an action potential, and each row of ticks is a trial. The raster plots have the spike density function (σ = 10 ms) superimposed.
