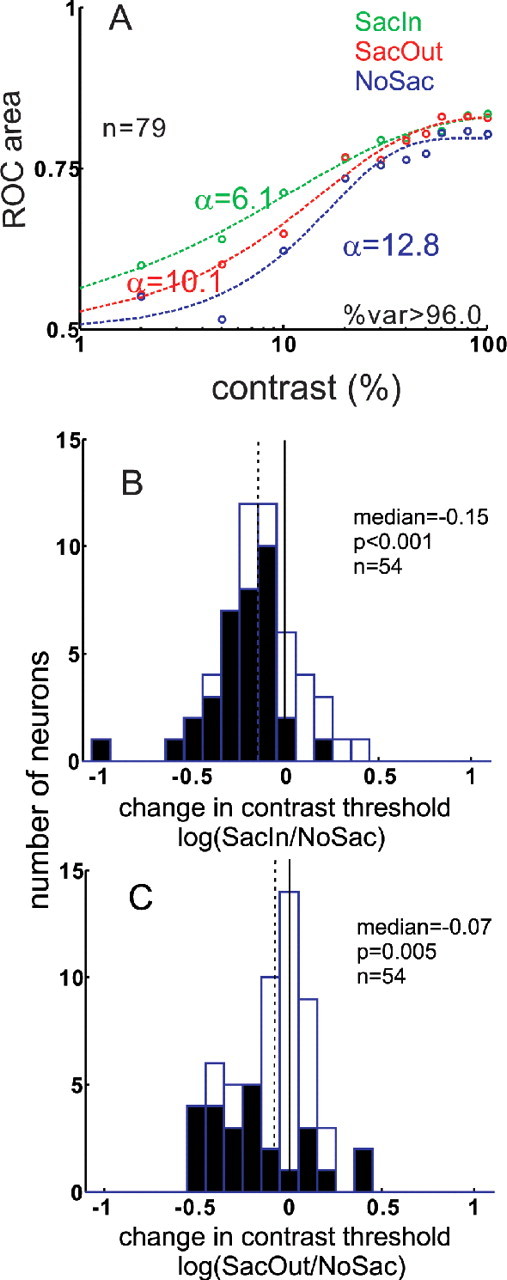
Figure 9.

Saccade cue condition alters SC neuronal sensitivity to contrast. A, ROC area values are plotted against contrast condition for the three cueing conditions: blue circles, NoSac; green circles, SacIn; and red circles, SacOut for all 79 SC neurons. The dashed lines illustrate the best fitting Weibull functions through the data points (see Materials and Methods). The α parameter of Weibull function indicates the contrast threshold for the neurons. B, Change in the contrast threshold was determined by taking the log of the ratio of SacIn to NoSac α parameters. Filled bars indicate statistically significant changes in the α parameter (Wilcoxon's test, p < 0.001). The median change in α parameter was −0.15. C, Same as in B for the SacOut trial condition. The median change in the α parameter was −0.07. In both B and C, only the 54 of 79 neurons that were well fit with Weibull functions in both conditions are shown. In both B and C, solid vertical lines indicate no change, whereas the dashed vertical lines indicate the change in the contrast threshold.
