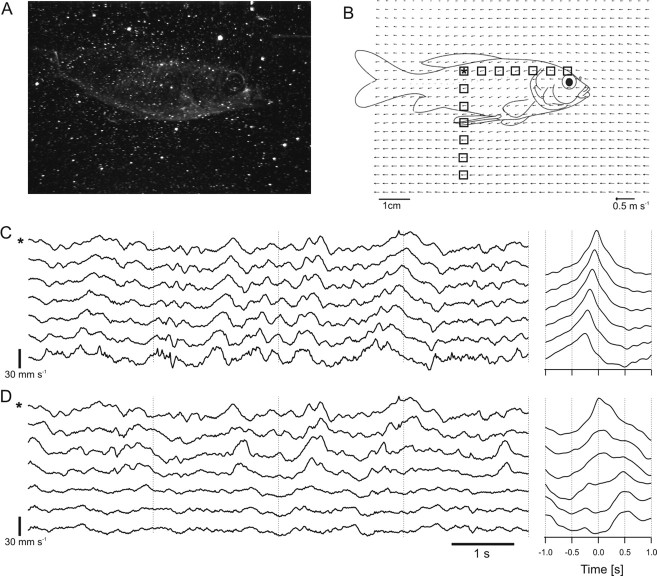
Figure 2.
Signal from the camera (A) and corresponding water velocity vector field (B). Note that the vector field consists of 32 × 32 IW. The scale bars (for A and B) and reference vector (B) are indicated. The flow velocity profiles shown in C and D were retrieved from the IWs indicated by squares in B. From the IW marked by an asterisk in B, the top flow velocity profiles in C and D were retrieved. Gross flow velocity was 13.5 cm s−1. C, D, Left, Flow velocity fluctuations retrieved from the horizontally (C) and vertically (D) arranged interrogation windows shown in B. Note that flow fluctuations propagated horizontally with the gross flow (C). C, D, Right, Correlation of the respective top flow velocity profile (marked by an asterisk) with the respective flow velocity profiles obtained from the IWs arranged in the horizontal (C) and vertical (D) row.

