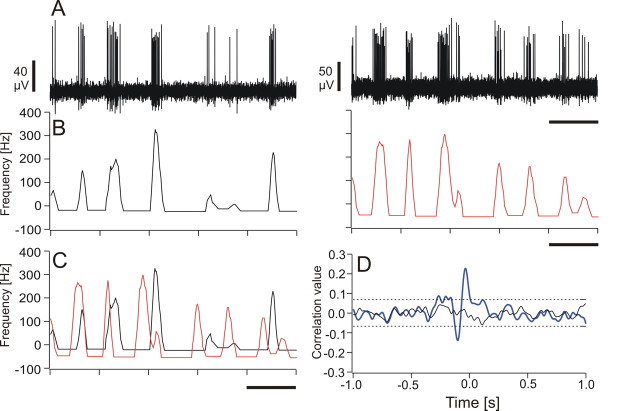
Figure 4.
A–D, Cross-correlation of neuronal data. A, Original traces of simultaneously recorded spike trains. B, Relative instantaneous frequency (IF, mean subtracted) of the spike trains shown in A. C, Superimposed IF of both spike trains shown in B. D, Cross-correlation function (blue) of the two IFs and of the shuffled data (black) shown in C. The dashed lines indicate the positive and the negative z value of the shuffled data. The black bars in A–C represent a timescale of 0.2 s.

