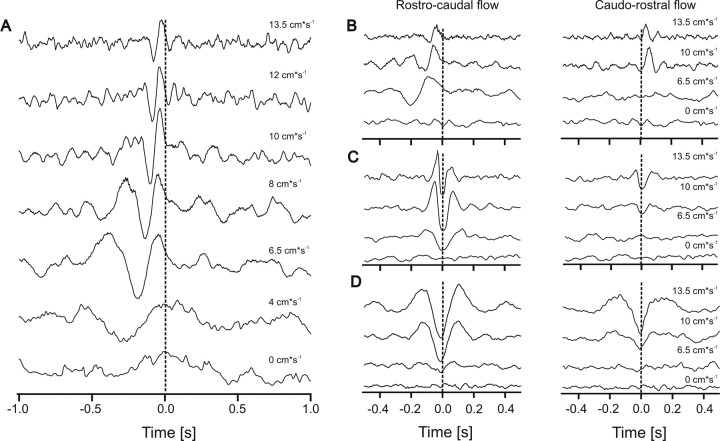
Figure 5.
A–D, Cross-correlation functions of the firing frequencies of pairs of afferents recorded simultaneously. A, From bottom to top, gross flow velocities were 0, 4, 6.5, 8, 10, 12, and 13.5 cm s−1. Gross flow direction was from rostral to caudal. B–D, Cross-correlation functions of three simultaneously recorded spike train pairs. Gross flow was from rostral to caudal (left) and from caudal to rostral (right). Note that the data show both correlation (B) and anticorrelation (C, D). Flow velocities were 0, 6.5, 10, and 13.5 cm s−1. Note that there is no correlation in still water and that higher flow velocities systematically shift the time of maximal correlation (indicated by the vertical lines in B–D).

