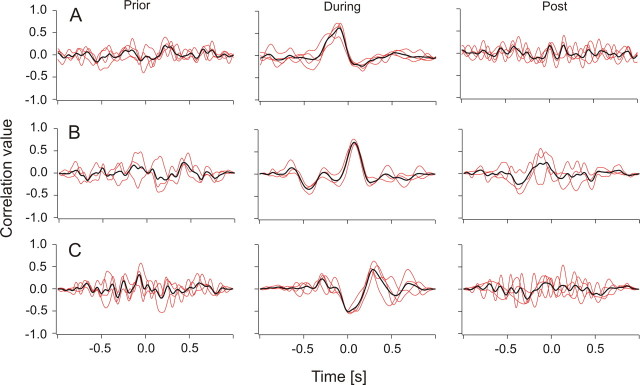
Figure 7.
Cross-correlation functions (red, single traces; black, average of single traces) of spike trains simultaneously recorded from PLLN fibers. Each red trace is the correlation of a pair of spike recordings. The fish was exposed to an object that passed its trunk with a velocity of 17 cm s−1. Left, Two seconds before the object passed the fish; middle, while the object passed the fish; right, after the object had passed the fish. A, A fiber pair whose responses were highly correlated if the object motion was from anterior to posterior. B, Same fiber pair as in A, but object motion direction was from posterior to anterior. C, A fiber pair that showed anticorrelation (motion direction was from anterior to posterior).

