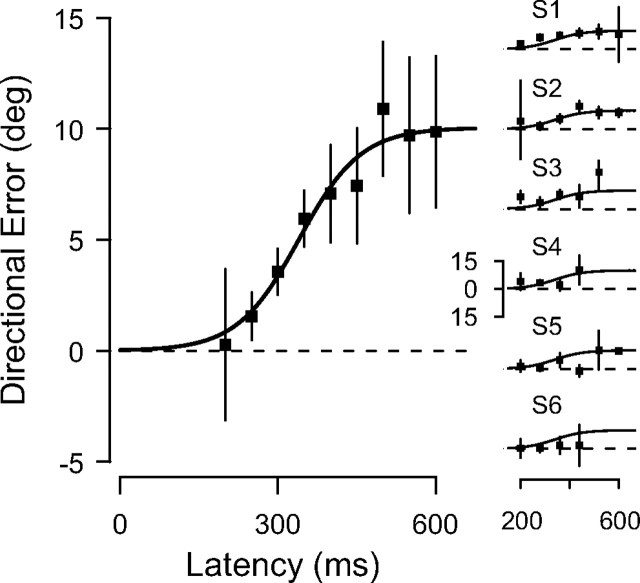
Figure 2.
Left, Buildup of the motion-induced saccadic directional error in the motion task, pooled over all subjects, together with the logistic fit. Bin width, 50 ms. Error bars represent 95% confidence interval. Right, Individual plots. The logistic fit obtained from the pooled data is plotted for comparison. Bin width, 80 ms. Error bars represent 80% confidence interval. S1–S6, Subjects 1–6.

