
Figure 3.
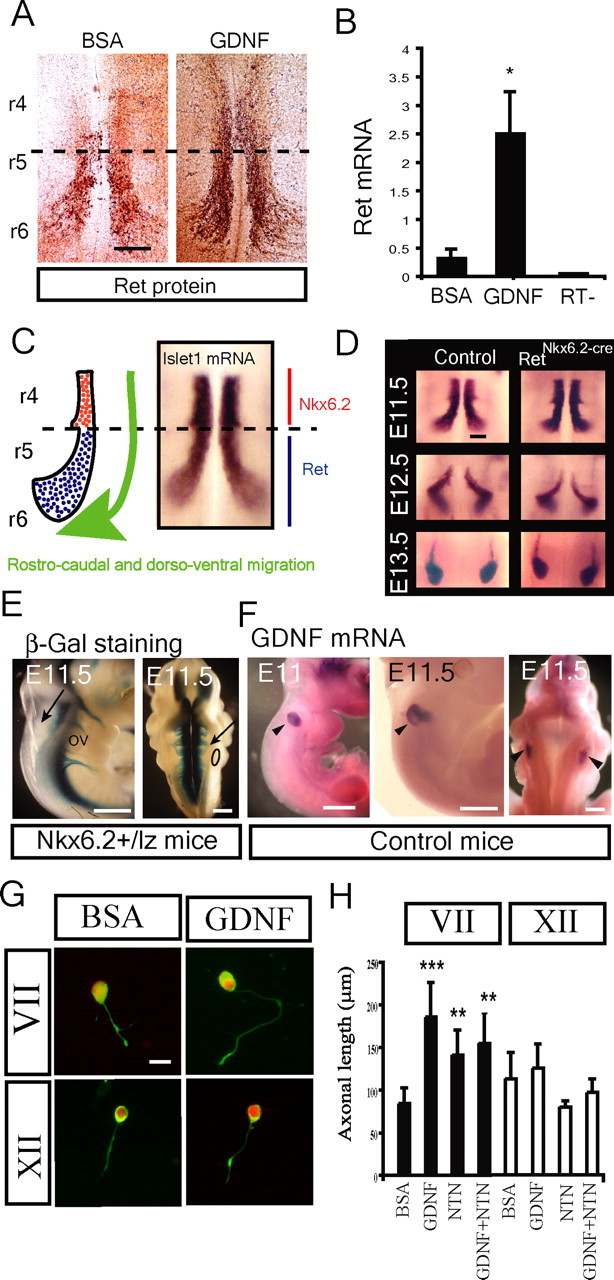
Ret activated Ret expression and Ret induced axonal growth in facial but not hypoglossal motor neurons. A, GDNF (50 ng/ml) upregulated Ret protein expression in organotypic culture of E11.5 hindbrains [rhombomere 4–6 (r4–r6)] after 6 h compared with BSA-treated control. Whole-mount immunostaining with Ret antibody on the control samples shows Ret expression restricted to migratory and postmigratory motoneurons (r5–r6, limited by dashed lines). GDNF induces increased expression of Ret in migrating motor neurons (r5–r6) as well as a precocious expression by premigatory motoneurons (r4). B, GDNF upregulated Ret mRNA expression in organotypic culture of E11.5 hindbrains [rhombomere 4–6 (r4–r6)] after 6 h compared with BSA-treated control (RT−, reaction without reverse transcriptase). Quantitative real-time PCR was conducted for ret mRNA (mean ± SEM of 3 independent experiments). C, Schematic illustration and islet1 in situ hybridization of an open-book preparation of hindbrain showing the path of facial motor neuron migration. Premigratory (red) cells express Nkx6.2, whereas migrating and postmigratory cells express Ret (blue) (Vallstedt et al., 2001). D, Islet1 staining revealing that elimination of Ret as detected in RetNkx6.2-Cre mice did not affect cell migration. E–H, GDNF is expressed along the axonal pathway of the facial nerve and promotes axonal growth of facial but not hypoglossal motoneurons in primary culture. E, The facial nerve exits the hindbrain at the level of the otic vesicle (arrows) as shown by the lateral (left) and dorsal (right) view of E11.5 Nkx6.2+/lz embryos after β-gal staining. F, Specific expression of GDNF mRNA in the otic vesicle of wild-type E11 and E11.5 embryos (black arrowheads) as shown by in situ hybridization. G, H, Axonal growth of facial but not hypoglossal motor neurons is affected by GDNF and NTN. G, Facial and hypoglossal motoneurons from E11.5 wild-type embryos were cultured in the presence of BSA or 50 ng/ml GDNF and stained for peripherin (green) and Islet1 (red) and the length of the axons measured. H, Quantification of axonal length in the presence of BSA or 50 ng/ml neurotrophic factors (GDNF, NTN, and GDNF plus NTN) in primary culture of facial and hypoglossal motor neurons (n = 50–100). Graphs represent the mean ± SEM. *p ≤ 0.05; **p ≤ 0.005; ***p ≤ 0.0005. Scale bars: A, 100 μm; E, F, 250 μm; H, 20 μm.