
Figure 5.
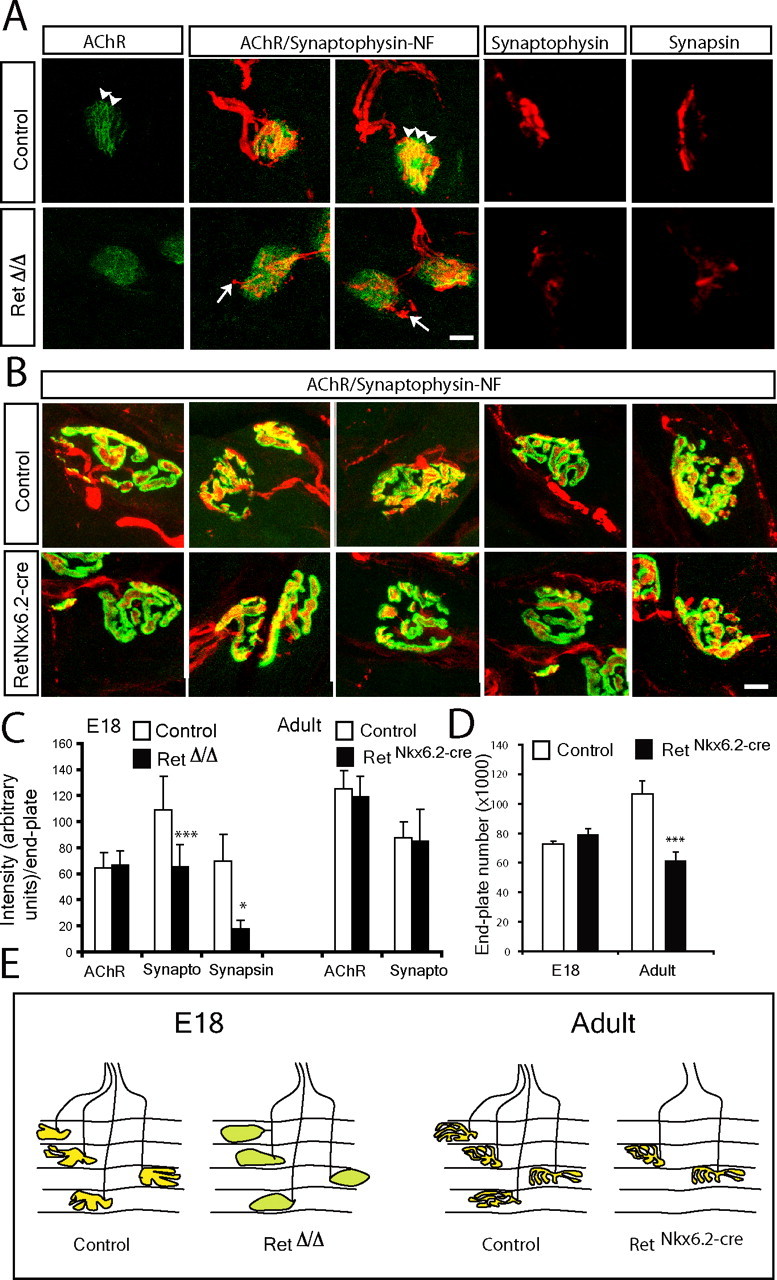
Deficits of synapse maturation in the absence of Ret signaling. A, B, Photomicrographs of neuromuscular synapses in the E18 (A) and adult (B) tongue of control and the Ret-deficient mice (RetΔ/Δ in A and RetNkx6.2-Cre in B). The presynaptic region was stained by synapsin I or synaptophysin immunohistochemistry (red, as indicated). AChRs in the postsynaptic membrane were labeled by fluorescent coupled bungarotoxin binding (green). Neuromuscular junctions visualized by a triple staining that combined synaptophysin-neurofilament (synaptophysin-NF; red) with bungarotoxin binding (AChR; green) are indicated. In A, note the reduction in the immunostaining of presynaptic components (synapsin I and synaptophysin) in Ret-deficient mice. The postsynaptic AChRs are more aggregated in control than RetΔ/Δ mice at E18 (arrowheads). Also note terminal sprouts in RetΔ/Δ mice (arrows in A), whereas general morphology of both presynaptic and postsynaptic elements of the neuromuscular junction is similar between adult control and RetNkx6.2-Cre mice (B). C, Quantification of synaptophysin (synapto) and synapsin immunoreactivity as a measure of synapse maturations at the neuromuscular synapse and AChRs staining intensity at E18 and in adult mice. Note the significant loss of synaptophysin and synapsin but not postsynaptic AChRs in the absence of Ret signaling at E18. No significant difference was found in adult mice. D, Quantification of the total number of AChR containing endplates in serial sections through the entire tongue at E18 and in the adult of both genotypes. Note a significant reduction of the total number of endplates in adult RetNkx6.2-Cre mice. E, Schematic illustration summarizing our interpretation of the results from the above studies depicting vesicle containing presynaptic terminals overlaying the postsynaptic AChR membrane in control mice (yellow). In E18 RetΔ/Δ mice, synapses are less developed (green) but in similar number as in control embryos. Adult RetNkx6.2-Cre mice display a reduced number of synapses, which otherwise appear normal. Graphs represent the mean ± SEM. ***p ≤ 0.005; *p ≤ 0.05. Scale bars, 10 μm.