
Figure 4.
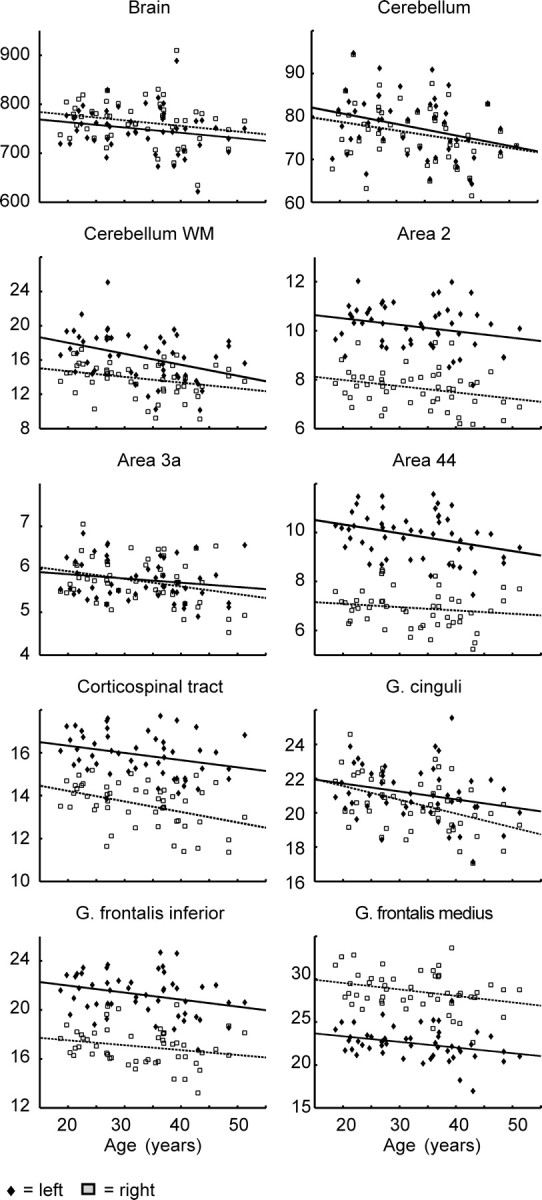
Scatterplots showing individual ROI volume data (in cm3), as well as regression lines (separately for each hemisphere) against age. Diamonds/rectangles, ROI volume in left/right hemisphere; solid/dashed lines, regression lines of left/right hemisphere.