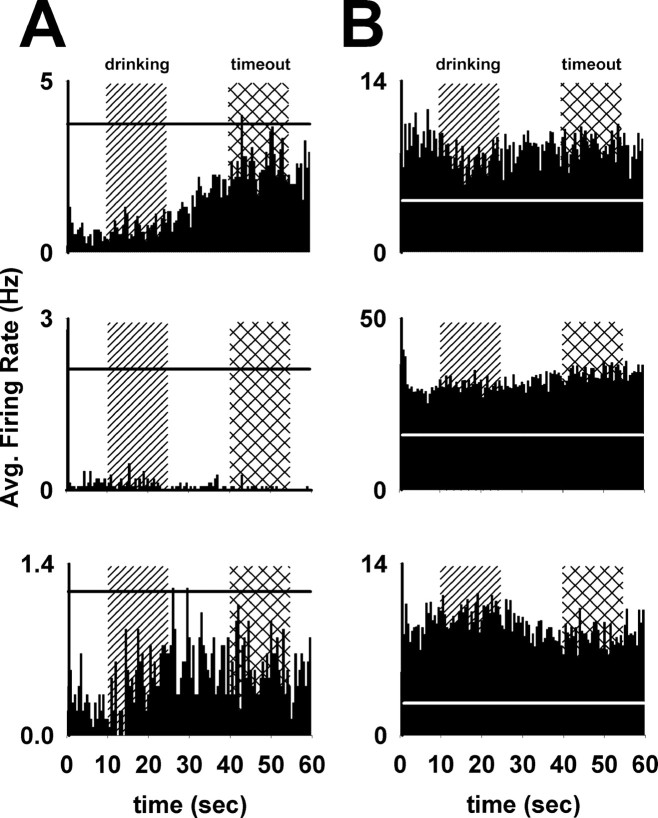
Figure 4.
Examples of changes in background firing rate. A, Three examples of neurons that exhibited decreases in background firing rate during the operant phase. These plots show perievent histograms of the 30 trials in the first sucrose reward phase from the completion of the lever-press response (time = 0 s) to the reentry of the lever (time = 60 s). The drinking period (10–25 s after the press) and the timeout period (40–55 s after the press) are represented by vertical background bars. Horizontal lines represent the average firing rate of each neuron during the baseline period preceding the operant phase. B, Three examples of neurons that exhibited increases in background firing rate during the operant phase, with plot parameters identical to those in A.

