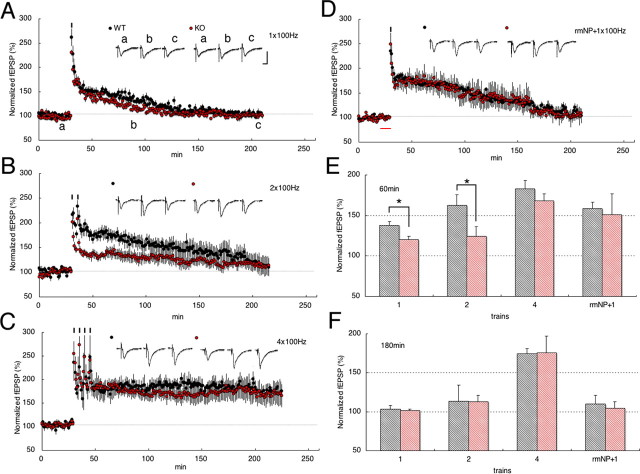
Figure 1.
E-LTP was decreased by neuropsin deficiency and reversed by application of rmNP. A, B, One 100 Hz train of stimulus (A) and two 100 Hz trains of stimulus (B) induced E-LTP in WT mice. E-LTP expression was significantly decreased in mice deficient in neuropsin (KO). C, Four 100 Hz trains of stimulus (strong) induced stable L-LTP both in WT and in KO mice. Note that L-LTP expression was not declined in KO. D, rmNP administration before a single train of stimulus (rmNP plus single100 Hz) in KO mice reversed E-LTP. The red bar indicates rmNP administration. E, Summary histogram showing E-LTP at 60 min after induction. E-LTP expression was significantly decreased by one 100 Hz and two 100 Hz trains in KO. F, Summary histogram showing L-LTP at 180 min after induction. Calibration: 1 mV, 10 ms. Asterisks indicate statistical significance (*p < 0.05). Error bars indicate SEM. Inset traces show sample fEPSPs recorded during the baseline (a) period and at 60 min (b) and 180 min (c) after stimulation. Black short vertical bars indicate tetanic trains.

