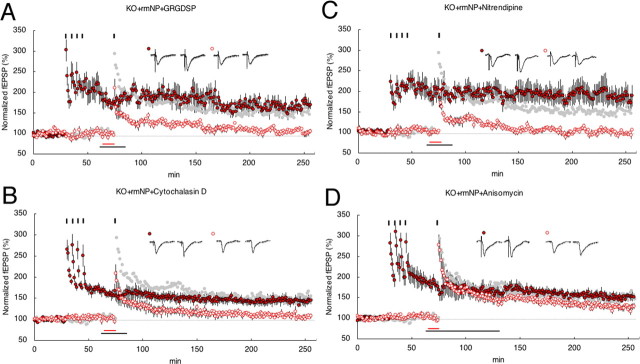
Figure 4.
Neuropsin-dependent late associativity and its downstream signaling through integrin/actin into LVDCC. A, GRGDSP (100 μm) coadministration with rmNP in KO slices inhibited the expression of stable L-LTP in S1 (red open circles) after four trains of 100 Hz tetanus in S0 (red filled circles). B, Cytochalasin D (0.5 μm) coadministration with rmNP in KO slices inhibited the expression of stable L-LTP in S1 (red open circles) after four trains of 100 Hz tetanus in S0 (red filled circles). C, Nitrendipine (5 μm) coadministration with rmNP in KO slices inhibited the expression of stable L-LTP in S1 (red open circles) after four trains of 100 Hz tetanus in S0 (red filled circles). D, Anisomycin (20 μm) rmNP coadministration in KO slices. The black bar indicates periods of drug administration. The red bar indicates periods of rmNP administration. An fEPSP in the S0 pathway is shown by filled circles, and an fEPSP in the S1 pathway is shown by open circles. Calibration: 1 mV, 10 ms. The 100 Hz-captured LTP in the absence of inhibitors (taken from Fig. 2D) is depicted in light gray for comparison. Inset traces show sample fEPSPs recorded during the baseline (a) period and 180 min (b) after stimulation at S1. Black short vertical bars indicate tetanic trains, respectively.

