Figure 10.
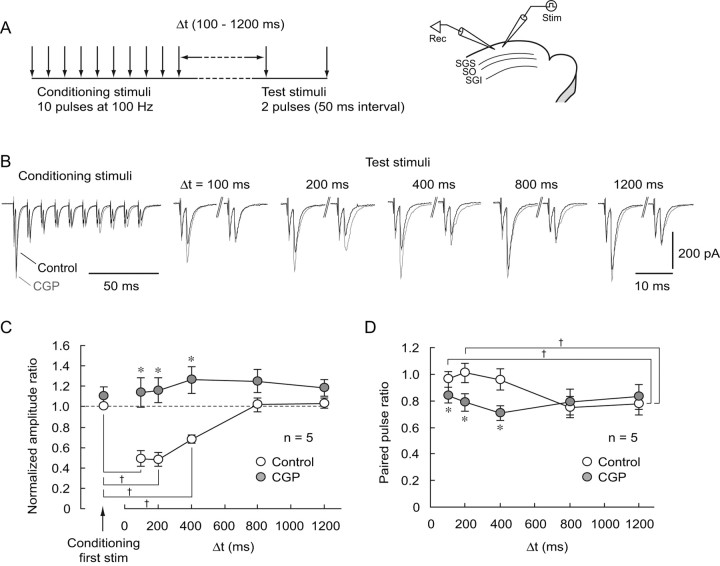
Synaptically released GABA activates presynaptic GABABRs and reduces glutamatergic transmission. A, Left, Schematic showing the stimulation protocol. Conditioning stimulations consisting of 10 pulses at 100 Hz were delivered to the SGS. Subsequently, after an interval of 100–1200 ms (Δt), test stimuli (2 pulses with an interval of 50 ms) were delivered to the SGS via the same stimulating electrode. Right, Schematic showing the electrode arrangement. A stimulating electrode was placed in the SGS, and whole-cell recordings were obtained from SGS non-GABAergic neurons. B, Conditioning stimulations greatly reduced the amplitude of the first test stimulation-evoked EPSCs at intervals of 100–400 ms, but not at 800 and 1200 ms, compared with that evoked by the first conditioning stimulus (black traces, Control). Application of CGP greatly increased the amplitude of the test stimulus-evoked EPSCs at intervals of 100–400 ms, but not at 800 and 1200 ms (gray traces, CGP). Voltage-clamp recordings were performed in the presence of gabazine (10 μm) and APV (50 μm) at a holding potential of −65 mV. Pipette solution contained 5 mm QX-314 and 0.6 mm GDPβS to block postsynaptic GABAB responses. C, A summary showing the normalized amplitude ratios plotted against intervals of test stimuli. EPSCs amplitudes were normalized with the amplitude of EPSCs evoked by the first conditioning stimulus under the control condition. The amplitude of EPSCs evoked by the first test stimulus at intervals of 100–400 ms, but not at 800 and 1200 ms, was significantly smaller than that evoked by the first conditioning stimulus. † p < 0.05. At intervals of 100–400 ms, the amplitude ratios were significantly increased by CGP application (closed circles, *p < 0.05, compared with control), whereas they were not significantly affected at intervals of 800 and 1200 ms. D, A summary showing paired pulse ratios (amplitude of the second EPSC relative to the first) plotted against intervals between conditioning and test stimuli. In the control, paired pulse ratios gradually decreased as the intervals increased (open circles). The paired pulse ratio after an interval of 1200 ms was significantly different from those at 100–200 ms in control. † p < 0.05. CGP application (closed circles) significantly reduced the paired pulse ratio after intervals of 100–400 ms. *p < 0.05, compared with control.

