
Figure 2.
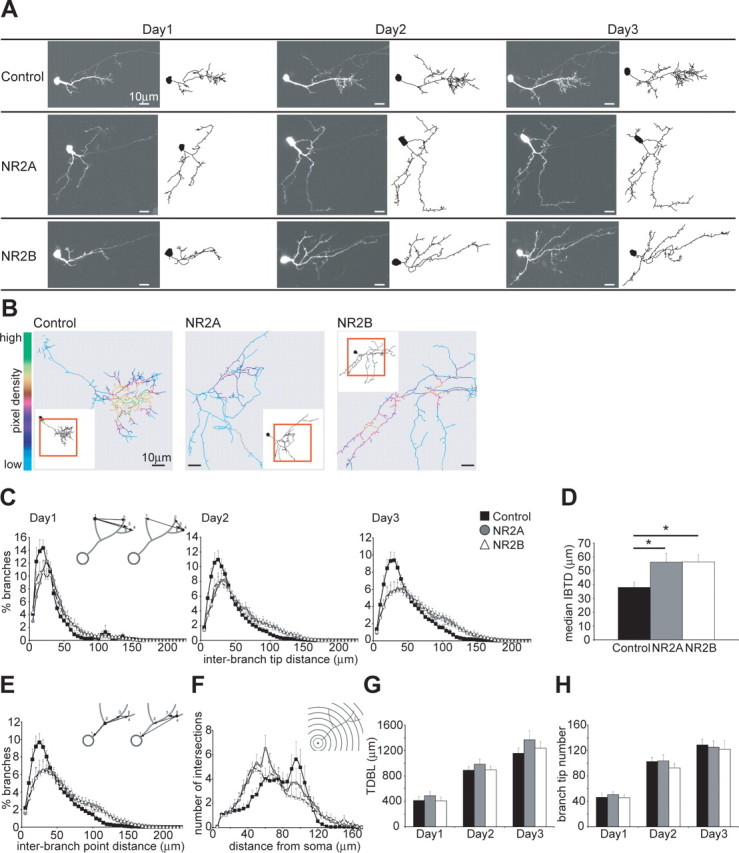
Exogenous expression of NR2A and NR2B decreases local dendritic branch clusters. A, Images and drawings of representative control and exogenous NR2A- and NR2B-expressing cells imaged once daily over 3 d. Axons present in the images are not shown in the drawings. B, Pixel density analysis shows areas of high pixel density with yellow and green colors, and areas of low pixel density with turquoise and blue colors, and highlights the differences in dendritic arbor architecture between control and NR2-expressing neurons. The inset shows the entire reconstructed cell and a red box surrounds the area seen in the pixel density analysis. C, Analysis of the IBTDs (see inset diagram) as neurons develop over 3 d. The distances are measured for every branch tip from one branch tip to every other branch tip on the dendritic tree. D, The median IBTD of each cell was calculated and the average per group is shown. NR2A- and NR2B-expressing cells have longer IBTDs than control cells (control, 37.94 ± 3.80 μm; NR2A, 56.30 ± 6.32 μm, *p < 0.03; NR2B, 56.45 ± 5.23 μm, *p < 0.02). E, Analysis of the interbranch point distance measured from one branch point to every other branch point (see diagram inset) confirms the different branch arrangement. F, Three-dimensional Sholl analysis (see diagram inset) characterizes arbor structure and complexity. G, H, Quantification of the average TDBL (G) and of the total BTN (H). The general growth parameters are similar between the groups on all 3 d: TDBL on days 1, 2, and 3, respectively (in μm), control, 412.97 ± 62.88, 889.40 ± 55.3, and 1156.08 ± 81.26; NR2A, 488.96 ± 62.87, 984.43 ± 80.11, and 1369.29 ± 139.58; NR2B, 406.57 ± 61.58, 896.54 ± 61.03, and 1236.25 ± 103.37; BTN on days 1, 2, and 3, respectively, control, 46.3 ± 6.83, 102.6 ± 6.54, and 128.8 ± 9.07; NR2A, 50.6 ± 4.8, 103.8 ± 9.38, and 125.2 ± 9.8; NR2B, 45.8 ± 4.35, 92.6 ± 6.59, and 122 ± 13.74; n = 10 cells per group. Error bars are SEM and all statistical tests are Mann–Whitney U tests.