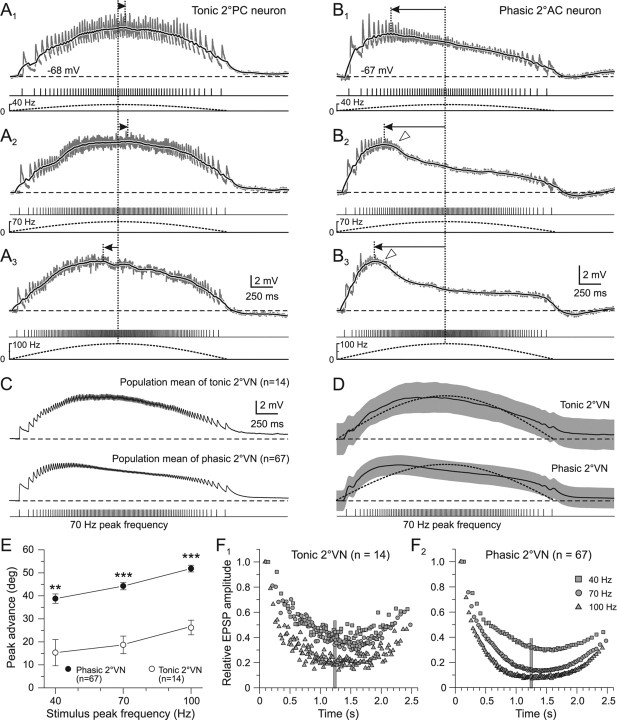
Figure 3.
Compound synaptic responses as a function of stimulus train peak frequency in phasic and tonic 2°VNs. A1–B3, Compound responses formed by summation of single EPSPs (gray traces) in a tonic 2°PC (A1–A3) and a phasic 2°AC (B1–B3) neuron after pulse-train stimulation with a peak frequency of 40 (A1, B1), 70 (A2, B2), and 100 Hz (A3, B3). The black traces are smoothed fits of the compound responses; bottom traces show pulse trains (half-cycle duration, 2.5 s) and stimulus frequency modulation (dashed lines), respectively; horizontal dashed lines indicate the resting membrane potential (−68 mV in A; −67 mV in B) and horizontal arrows the lag/advance of the compound response peak with respect to stimulus peak frequency (vertical dotted lines). Synaptic responses in A1–B3 are the averages of 12 single sweeps. Calibrations in A3 and B3 apply to A1, A2 and B1, B2, respectively; open arrowheads in B2 and B3 mark the truncation of the compound response. C, D, Population mean of compound responses (C) and smoothed fits (D) evoked by pulse trains with 70 Hz peak frequency and 2.5 s half-cycle length in tonic (n = 14) and phasic 2°VNs (n = 67). The gray bands in D indicate ±SE of the mean, the dotted curves indicate the stimulus modulation and the horizontal dashed lines the mean resting membrane potential of −69 mV in tonic and −68 mV in phasic 2°VNs. E, Advance (in degrees) of the compound response peak relative to stimulus peak frequency (mean ± SE) in phasic (●) and tonic 2°VNs (○) as a function of stimulus peak frequency. **p ≤ 0.001, ***p ≤ 0.0001, significant difference between tonic and phasic 2°VNs (Mann–Whitney U test). F1, F2, Average amplitude of individual EPSPs evoked by the single pulses of the train with peak frequencies of 40 (□), 70 (○), and 100 Hz (▵) in tonic (F1) and phasic 2°VNs (F2). Amplitudes were normalized to the size of the first EPSP. Plots of ±SE were omitted for clarity; vertical gray bars mark the timing of the stimulus peak frequency.

