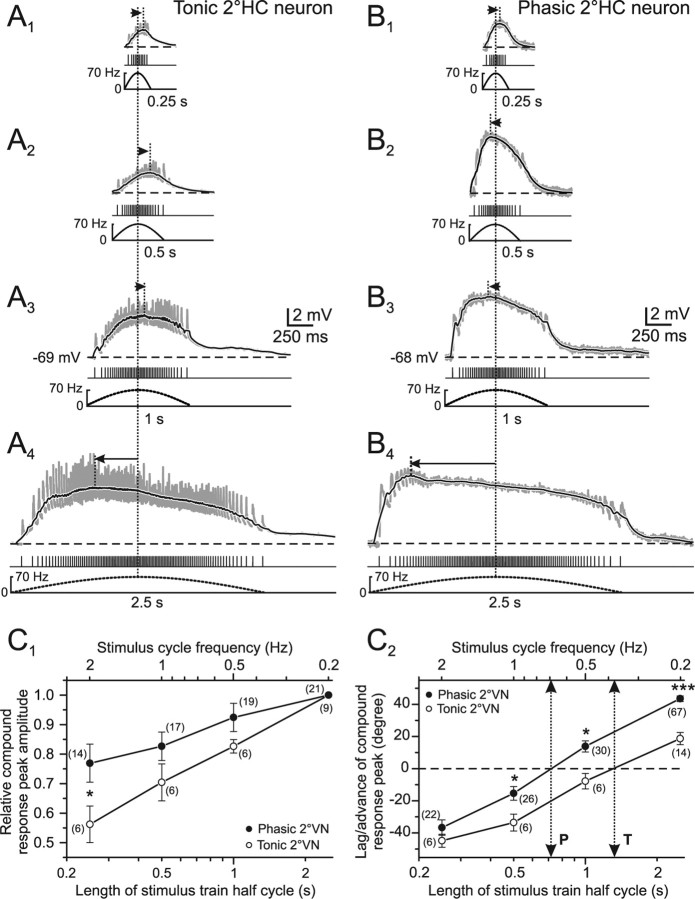
Figure 4.
Compound synaptic responses as a function of stimulus pulse train length in phasic and tonic 2°VNs. A1–B4, Compound responses of single EPSPs (gray traces) in a tonic (A1–A4) and a phasic (B1–B4) 2°HC neuron after pulse-train stimulation with 0.25 (A1, B1), 0.5 (A2, B2), 1 (A3, B3), and 2.5 s (A4, B4) half-cycle length. The peak frequency was 70 Hz and pulse intensity was 1.8× T in A and 1.7× T in B. Black traces are smoothed fits of the compound responses; bottom traces show pulse trains and stimulus frequency (dashed lines), respectively; horizontal dashed lines indicate the membrane potential (−69 mV in A; −68 mV in B) and horizontal arrows indicate the lag/advance in degree of the compound response peak with respect to stimulus peak frequency (vertical dotted lines). All records are the average of 12 responses. Calibrations in A3 and B3 apply to all other traces. C1, C2, Mean (±SE) of compound response peak amplitude (C1) and peak lag/advance relative to stimulus peak frequency (C2) of tonic (○) and phasic 2°VNs (●) as a function of stimulus half-cycle length (bottom axis) and corresponding full stimulus cycle frequency (top axis). Amplitudes in C1 were normalized to those obtained at a stimulus half-cycle length of 2.5 s; dotted two-sided arrows indicate half-cycle length and corresponding full-cycle frequency where response peak and stimulus peak frequency are aligned (0°; dashed horizontal line) in tonic (T) and phasic (P) 2°VNs. The number of neurons is indicated in parentheses. *p ≤ 0.05, ***p ≤ 0.0001, significance of difference between tonic and phasic neurons (Mann–Whitney U test).

