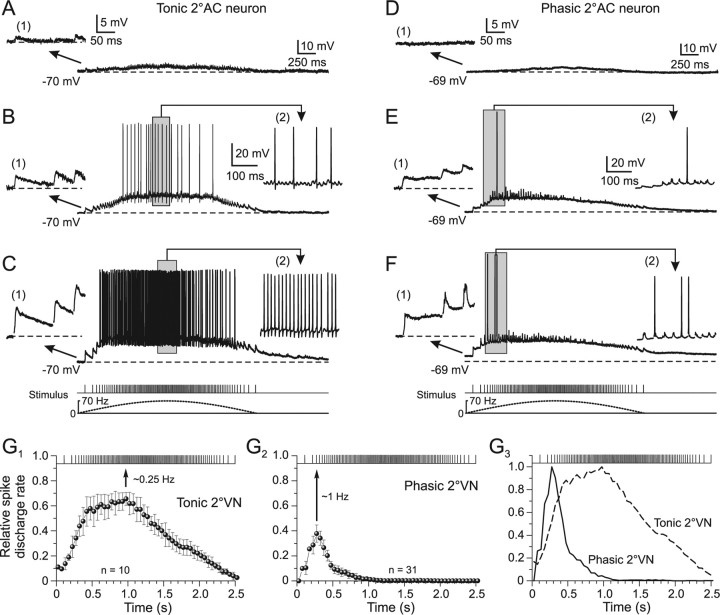
Figure 5.
Synaptic discharge dynamics as a function of stimulus pulse intensity in phasic and tonic 2°VNs. A–F, Compound responses and superimposed spikes in a tonic (A–C) and a phasic (D–F) 2°AC neuron after stimulation with sinusoidal pulse trains at a peak frequency of 70 Hz. The intensities for the single pulses were in the tonic 2°AC (A, 1.3× T; B, 1.8× T; C, 3.1× T) and in the phasic 2°AC neuron (D, 1.4× T; E, 2.0× T; F, 3.2× T); the first three single EPSPs of the train (1) and during the indicated period (gray area) of spike discharge (2) in A–F are shown at an extended time and amplitude scale; bottom traces in C and F show pulse trains (half-cycle duration, 2.5 s) and stimulus frequency (dashed lines) that also apply to A, B and D, E, respectively. Horizontal dashed lines indicate the membrane potential (−70 mV in A–C; −69 mV in D–F); records in B, C and E, F are single sweeps and in A and D, the average of 12 responses, respectively. Calibrations in A and D and insets (1) therein apply also to B, C and E, F, respectively; calibration in insets (2) in B and E apply also to insets (2) in C and F, respectively. G1–G3, Relative rate of evoked spike discharge (mean ± SE) during pulse trains with peak frequencies of 70 Hz in tonic (G1) and phasic 2°VNs (G2) at single-pulse intensity >2.5× T. The relative rate was calculated from the number of spikes in each cell during the stimulus train in 50 ms bins and divided by the number of stimuli within the respective bin. The discharge in phasic 2°VNs is confined to the first 10–15 single pulses of the train (G3, solid line), whereas in tonic 2°VNs it is more aligned with the frequency modulation of the single pulses (G3, dashed line). Curves in G3 were obtained by normalization to the peaks in G1 and G2, respectively. Peak discharge rate in tonic and phasic 2°VNs (G1, G2, arrows) corresponds to a full stimulus cycle of ∼0.25 and ∼1 Hz, respectively.

