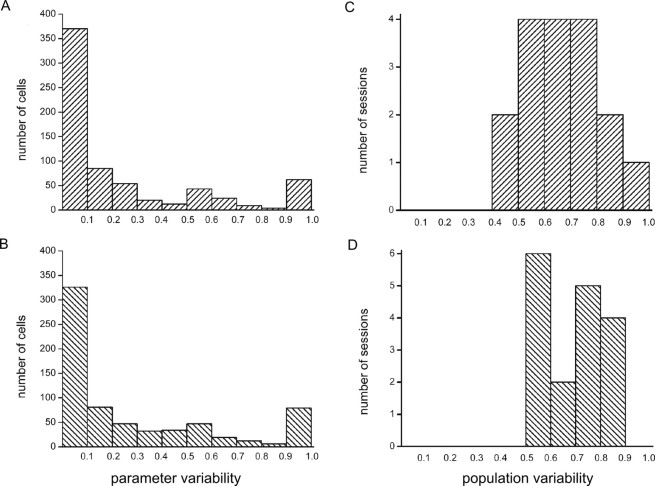
Figure 4.
Distribution of population variability and parameter variability across orbitofrontal cell populations. A, C, Waiting period; B, D, reward period. Values of population variability across sessions were generally in a high range between 0.4 and 1.0, with means of 0.71 and 0.73 for the waiting and reward periods, respectively. Parameter variability values varied more strongly, spanning the whole range from 0.0 to 1.0 for both periods, with means of 0.23 and 0.28 for the waiting and reward periods, respectively. Similar findings were obtained for the movement period, namely a mean Spar value of 0.25 and a mean Spop value of 0.76 (data not shown). Note the subgroup of cells with very high parameter variability (0.9–1.0).

