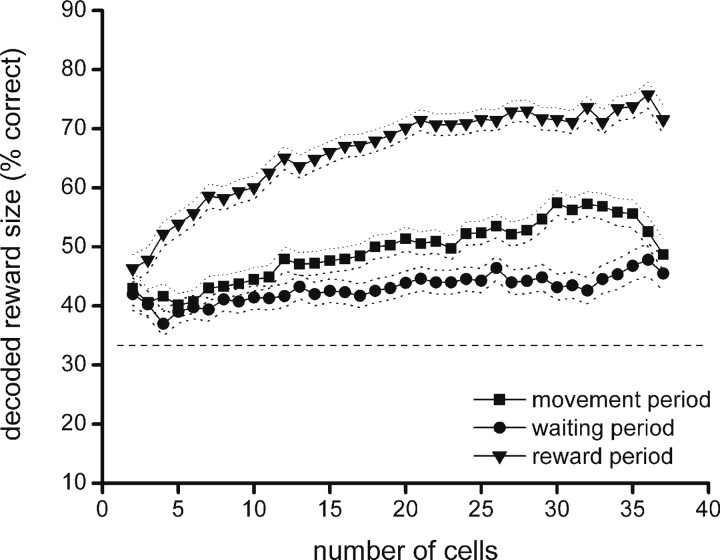
Figure 5.
Decoding of reward magnitude with template matching: dependence on ensemble size. The horizontal axis indicates the size of the reconstruction ensemble, and the vertical axis indicates the percentage of trials in which reward size was correctly decoded. In the graphs presented here and in Figures 6–7 and 9–10, the horizontal dashed line indicates chance level (33.3%), and dotted lines flanking the curves represent the 95% confidence interval (two times the SE of proportion).

