
Figure 6.
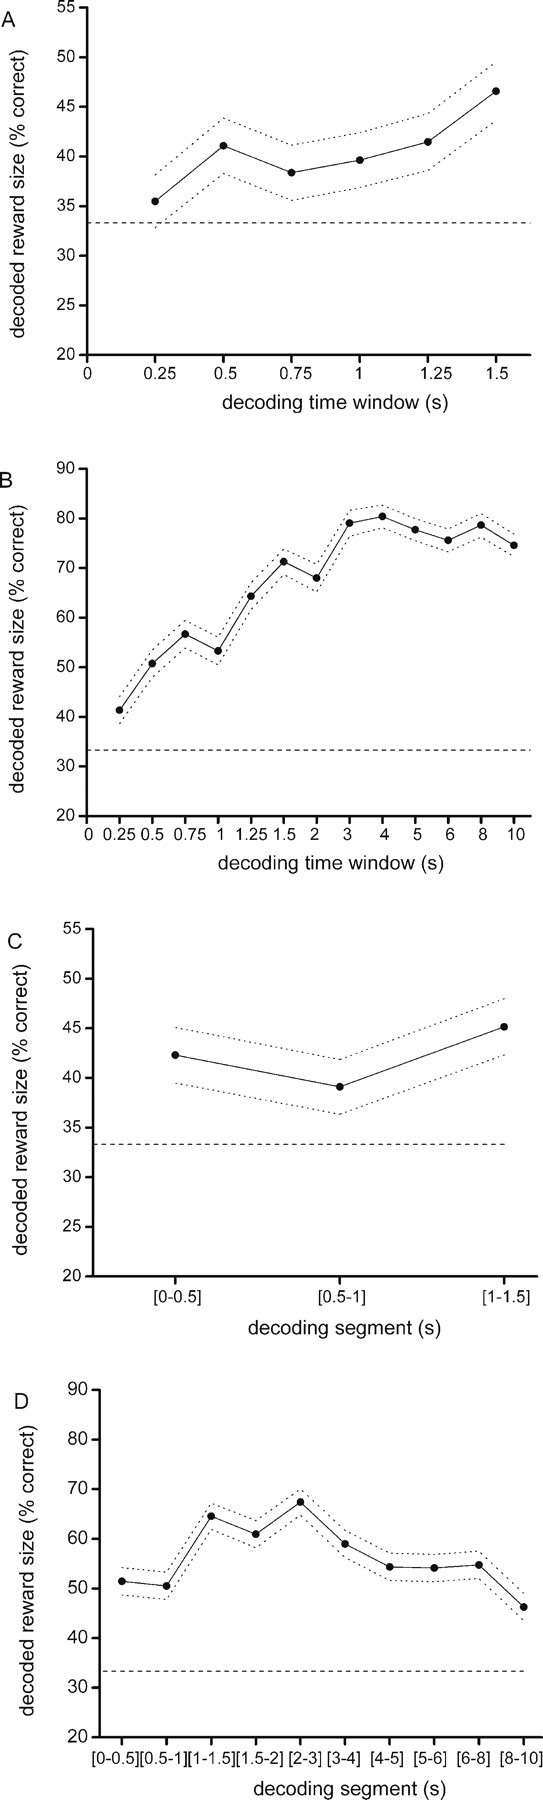
Decoding of reward magnitude within specific trial phases. The size of the reconstruction ensemble was 37 neurons. A, B, Decoding score using time windows of increasing duration for the waiting (A) and the reward delivery (B) periods. The horizontal axis shows the size of the time window (in seconds) from which spikes were taken for reconstruction, and the vertical axis shows the percentage of correctly decoded trials. C, D, The decoding success for consecutive temporal segments in the waiting and reward periods, respectively. The horizontal axis now shows the time segment of trial phase used for reconstruction. In C, the decoding segments are the intervals (0–0.5), (0.5–1.0), and (1.0–1.5) s relative to fluid poke onset. In D, the segments are (0–0.5), (0.5–1.0), (1.0–1.5), (1.5–2.0), (2.0–3.0), (3.0–4.0), (4.0–5.0), (5.0–6.0), (6.0–8.0), and (8.0–10.0) s relative to reward delivery.