Figure 7.
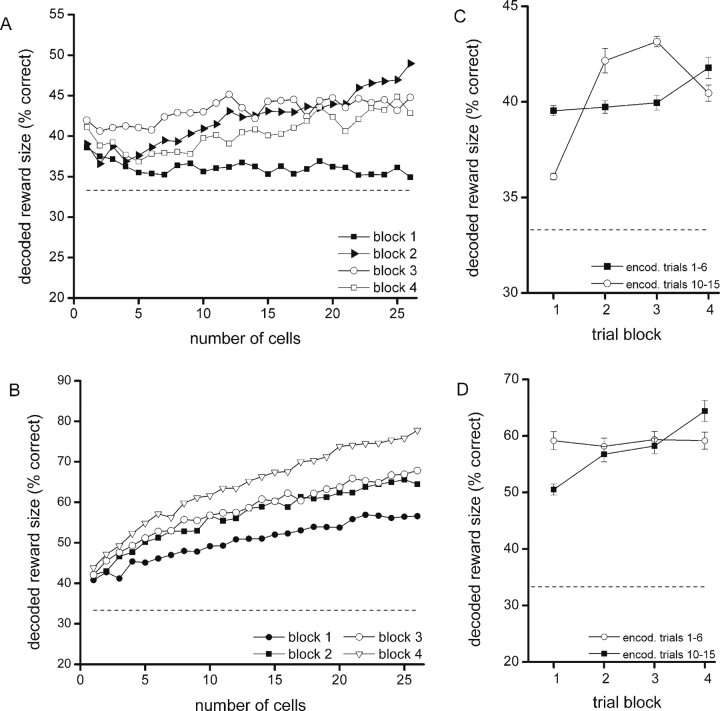
Changes in reconstruction success across consecutive blocks of learning trials. A, B, The percentage of correctly decoded reward amounts per trial block for the waiting and reward periods, respectively. In view of the reliability of reconstruction because of the low number of trials per trial block, a reconstruction ensemble of 26 neurons was used, which was the minimal number of neurons present in all sessions. The horizontal axis indicates the size of the reconstruction ensemble. In A and B, encoding vectors were obtained from trials 10–15 for each reward size. To maintain clarity, SEs of proportion are not shown, but these values were generally comparable to those in Fig. 4. C, D, Mean decoding success for the encoding by late trials (i.e., 10–15) and its temporal mirror image (encoding by early trials; i.e., 1–6) for the waiting (C) and reward (D) periods. The abscissa denotes the proximity of decoding trials to the encoding block; the larger the decoding block number, the closer that block is to the encoding block. Error bars indicate SEM values.

