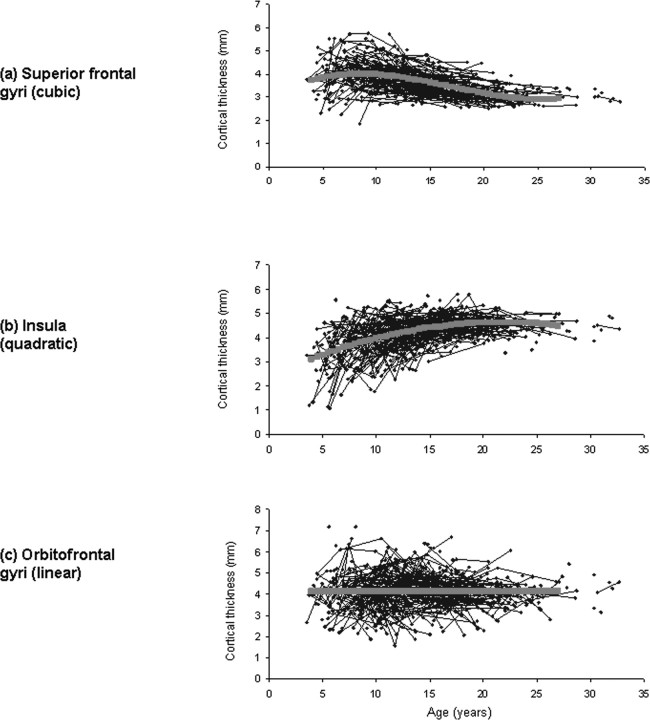
Figure 3.
Graphs showing raw cortical thickness data in blue, with the fitted trajectory superimposed in pink. a–c, The first three images show in order the mean cortical thickness and trajectory for representative regions: the superior frontal gyri, which have a cubic trajectory (a); the portion of the insula which has a quadratic trajectory, seen in green in Figure 5 (b); the portion of the orbitofrontal cortex which has a linear trajectory, seen in blue in Figure 4 (c).

