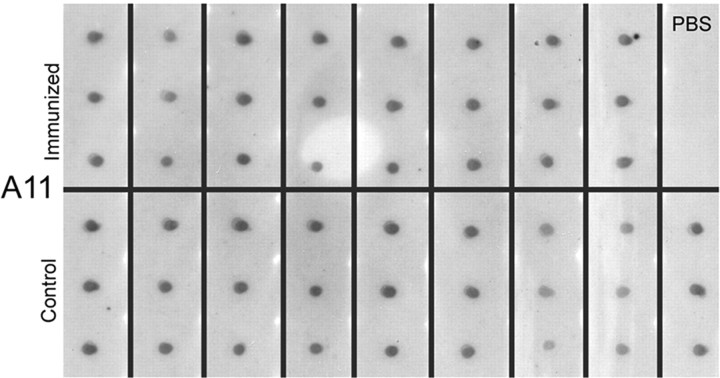
Figure 5.
Dot blot assays for oligomers (A11) in the prefrontal cortex with individual animals shown in triplicate illustrates individual variability in the amount of oligomers detected in animals despite an equal amount of protein loaded. In the prefrontal cortex, control animals (mean ± SD OD, 1501 ± 224.75) had similar levels of A11 compared with immunized animals (mean ± SD OD, 1400.6 ± 385.43). In addition, similar measures of A11 by dot blot in the parietal cortex also revealed no difference between controls (mean ± SD OD, 1250.5 ± 386.95) and immunized dogs (mean ± SD OD, 1284.8 ± 265.08). PBS indicates control samples.

