
Figure 10.
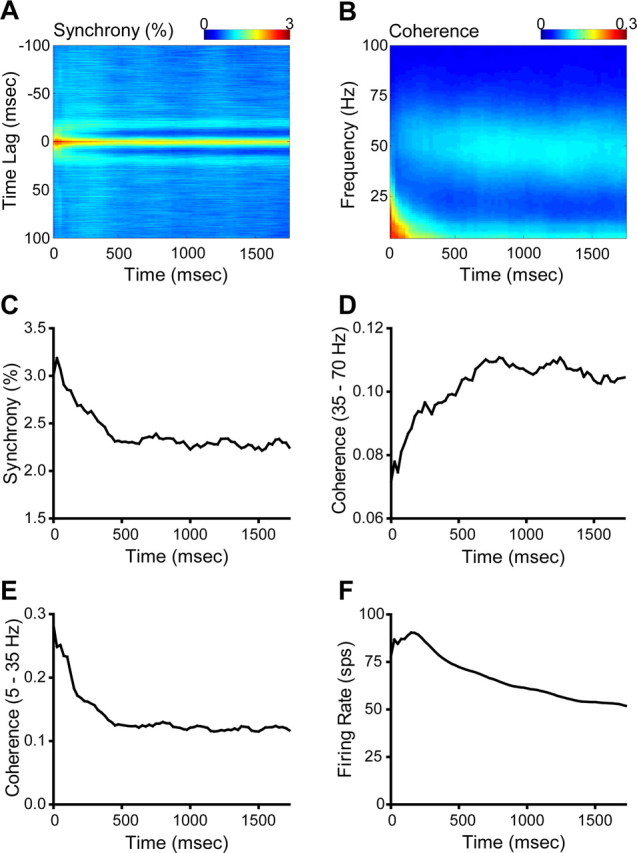
A, Population-averaged temporal dynamics of the CCH. B, Population-averaged temporal dynamics of coherence. C, Evolution of maximum synchrony versus time. D, Evolution of maximum gamma coherence versus time. E, Evolution of maximum coherence in the low-frequency band (5–35 Hz) versus time. F, Temporal dynamics of mean firing rate.