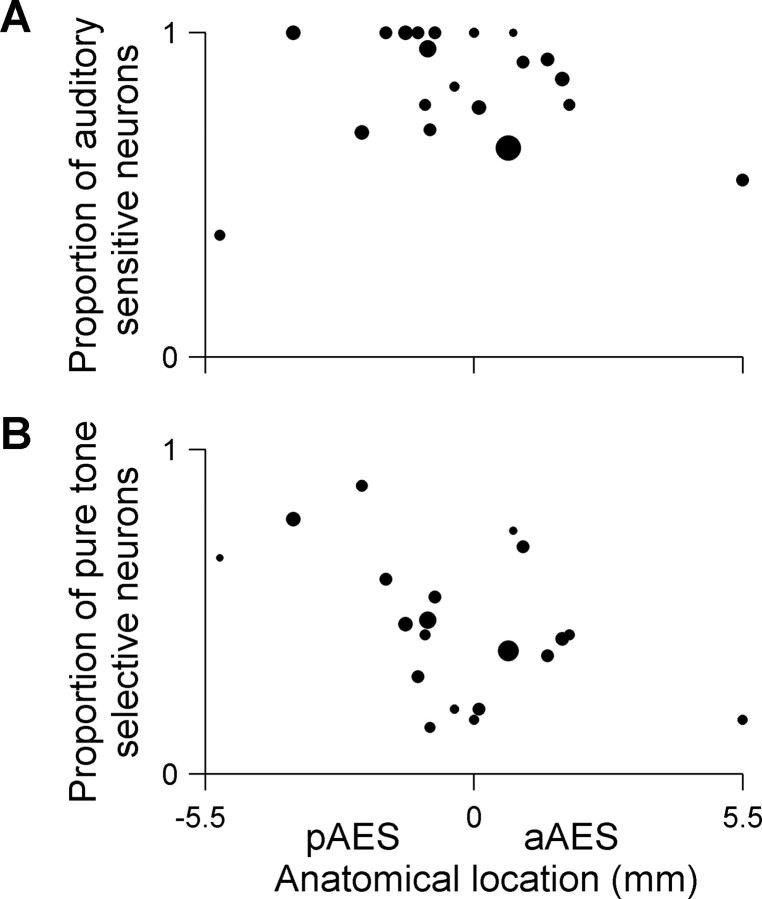
Figure 3.
Auditory responsiveness and pure tone selectivity along the AES posterior–anterior axis. A, Auditory responsiveness: each dot represents the proportion of neurons per electrode penetration that responded significantly to one of the auditory stimuli (either pure tone or VASS). The area of each dot is proportional to the total number of neurons that were recorded per electrode penetration. Only penetrations that contained >2 neurons were included (20 penetrations in 11 cats, average of 12.5 neurons per penetration). Auditory responsive neurons were spread equally along the AES (r = −0.08, ns). B, Pure tone selectivity: each dot represents the proportion of auditory responsive neurons per electrode penetration that showed pure tone selectivity. Same layout as in Figure 3A. Only neurons that were auditory responsive and that were tested with pure tones were included. Only penetrations that contained >2 neurons were included (20 penetrations in 11 cats, average of 10 neurons per penetration). The proportion of frequency-selective neurons decreased along the longitudinal axis of AES (r = −0.49, p < 0.05).

