Figure 5.

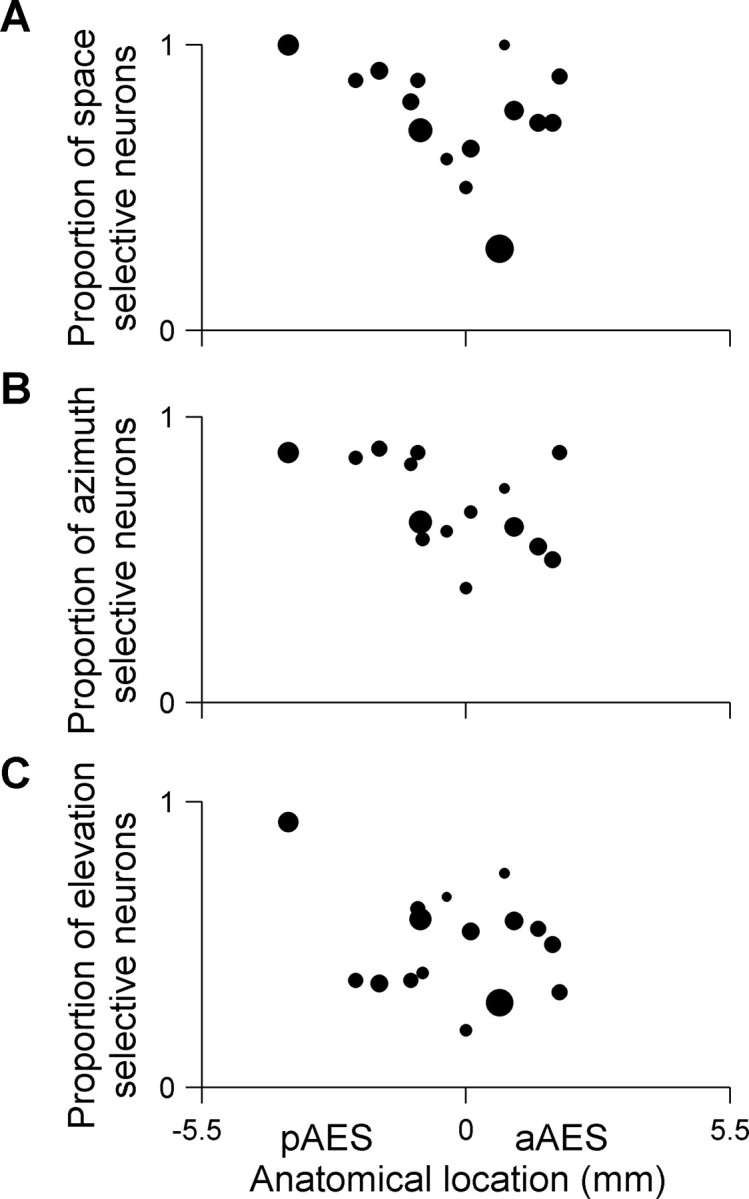
Space selectivity along the AES posterior–anterior axis. A, Space selectivity: each dot represents the proportion of space-responsive neurons that were space-selective in each electrode penetration. Space-responsive neurons were selective to azimuth, to elevation, or to both. The area of each dot is proportional to the total number of neurons that were space-responsive per electrode penetration (16 penetrations in 10 cats, average of 11 neurons per penetration). The proportion of space-selective neurons decreased along the longitudinal axis of AES (r = −0.41, p < 0.05). B, Azimuth selectivity: each dot represents the proportion of azimuth responsive neurons that were selective to azimuth (15 penetrations in 9 cats, average of 9 neurons per penetration). The proportion of azimuth responsive neurons that were selective to azimuth decreased along the posterior-anterior axis of AES (r = −0.53, p < 0.05). C, Elevation selectivity: each dot represents the proportion of elevation responsive neurons that were selective to elevation (16 penetrations in 10 cats, average of 10 neurons per penetration). The proportion of elevation responsive neurons that were selective to elevation decreased along the posterior-anterior axis of AES (r = −0.39, p < 0.05). The total number of penetrations in A and C is greater by one from the number of penetrations in B because in one penetration, only responses to varying elevations were recorded. In all cases, only penetrations with more than two responsive neurons are displayed.
