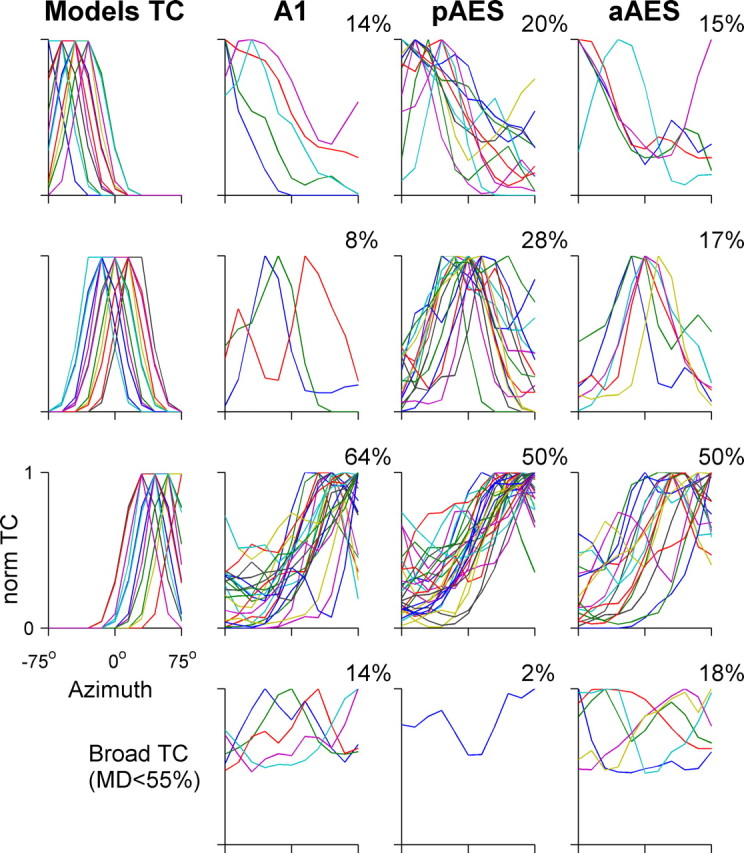
Figure 7.

Normalized tuning curves of azimuth selective neurons distributed by laterality. The bottom row displays broad tuning curves of spatially selective neurons with modulation depth <55% in A1, pAES, and aAES. The leftmost column displays the model tuning curves in each laterality class, used for the classification as described in Materials and Methods. The upper three rows display the tuning curves with modulation depths >55% of each laterality class. The proportion of neuronal tuning curves assigned to each class is displayed at each panel. The distributions of laterality classes in pAES and A1 were significantly different, as were the distributions of laterality classes in aAES and pAES.
