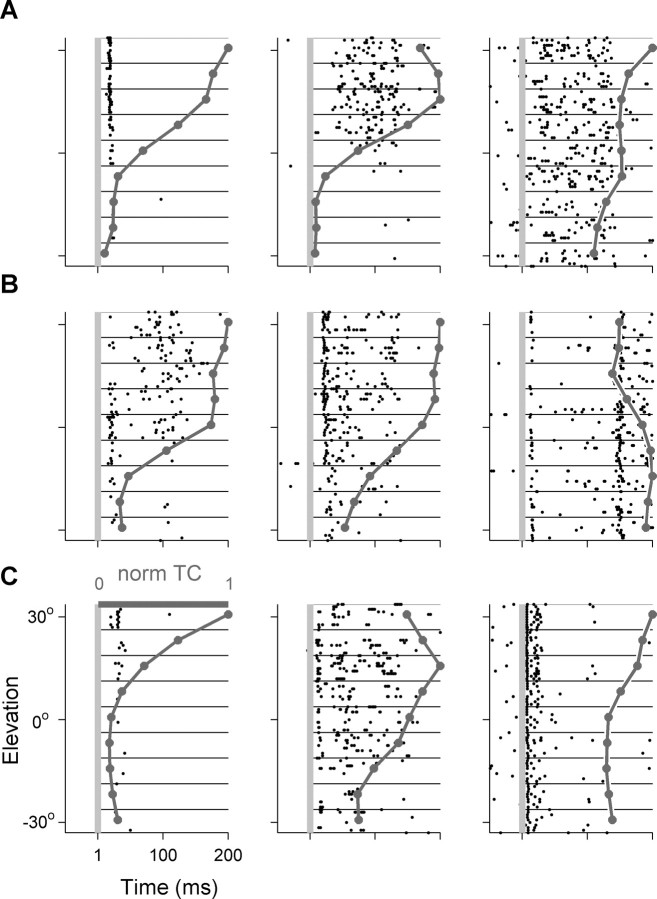
Figure 8.
Raster plots and normalized elevation tuning curves (dark gray line) of nine spatially selective neurons. The first two columns display responses of neurons with modulation depths >55%. The rightmost column displays elevation selective neurons that had modulation depths smaller than 55%. A, A1. B, pAES. C, aAES.

