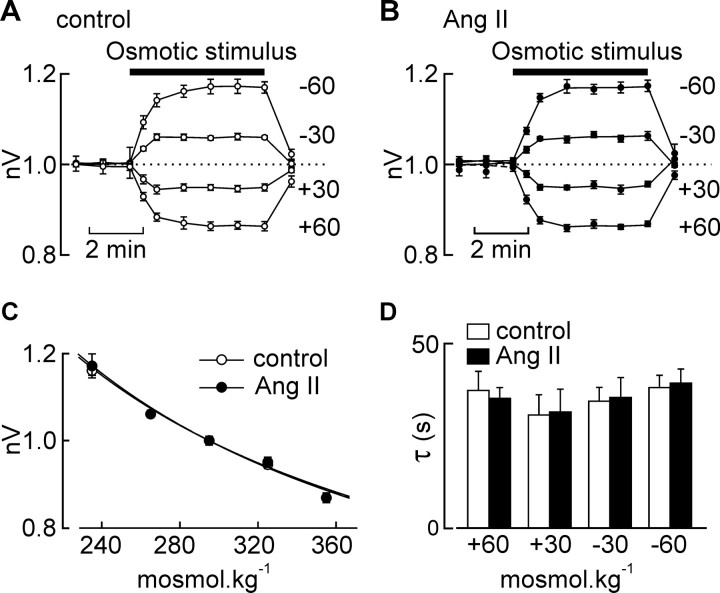
Figure 2.
Ang II does not affect osmometry. A, Graph plotting the mean (±SEM) values of nV recorded during osmotic stimulation (bar; amplitude indicated by the numbers at right) of MNCs under control conditions. B, Graph plotting the values of nV recorded from the same cells in the presence of Ang II. C, Graph plotting the mean (±SEM) steady-state values of nV observed under different osmotic conditions in the absence (control) and presence of Ang II. The lines are fits of the data sets using the Boyle van't Hoff equation. D, Bar graph plotting the mean (±SEM) values of the time constants describing the time course of changes in nV during osmotic stimulation in the absence (open bars) and presence (solid bars) of Ang II. Differences are not significant (p > 0.05).

