Figure 3.
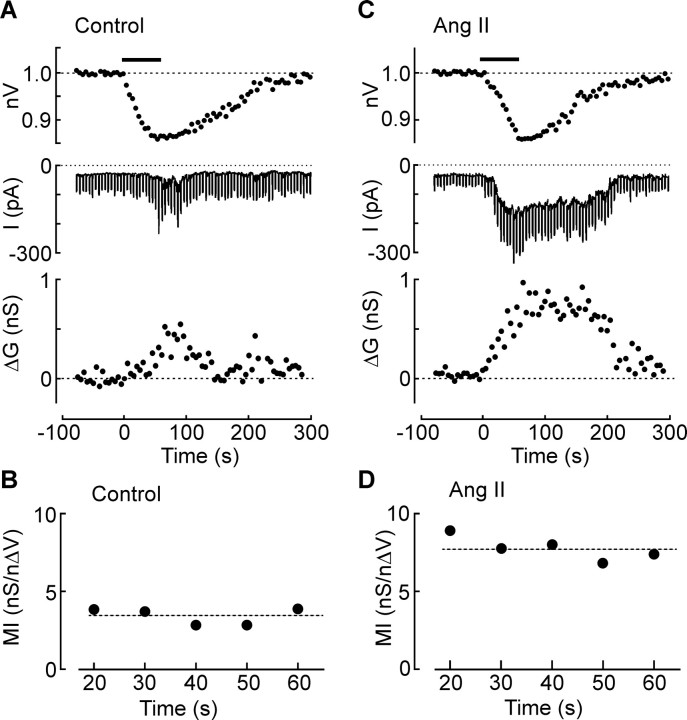
Ang II increases mechanosensitivity. A, Effects of applying negative pressure (−50 mmHg) to the recording pipette for 60 s (bar) on a cell recorded under control conditions. The top trace shows the change in nV, the middle trace shows the membrane current recorded under voltage clamp (Vhold, −60 mV). Negative deflections are the current responses (ΔI) induced by hyperpolarizing steps (−40 mV; 500 ms). The bottom trace shows values of ΔG computed from measurements of ΔI. B, Plot of the MI values computed from the data shown in the top traces. The dashed line represents the average of all MI values computed in this experiment. C, Effects of negative pressure (−50 mmHg) on another MNC recorded in the presence of Ang II (same layout as in A). Note the larger increases in ΔI and ΔG. D, Values of MI computed from the data shown in C.

