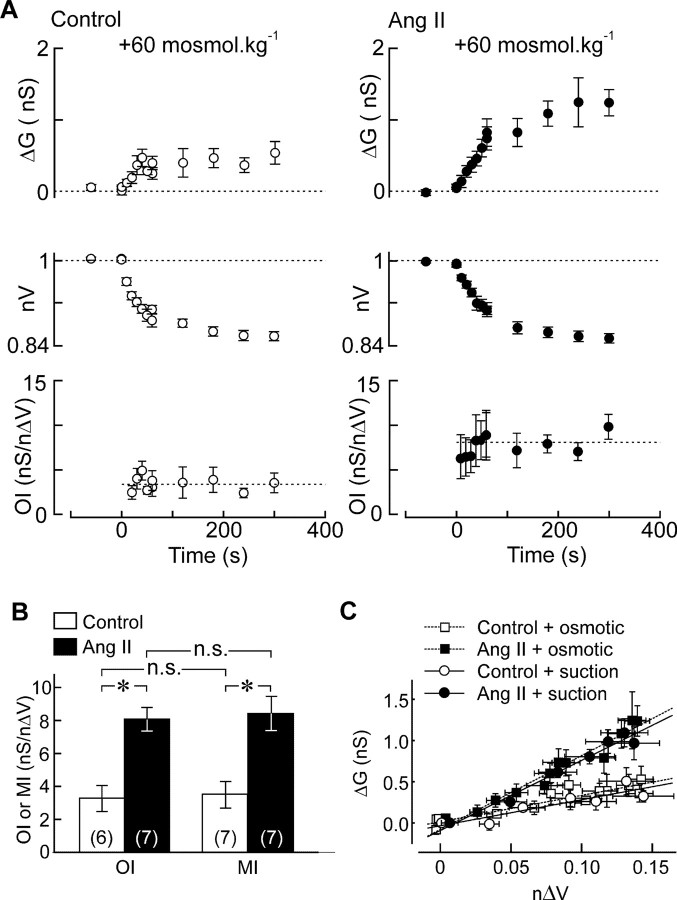
Figure 4.
Ang II potentiates osmosensory transduction by enhancing mechanosensitivity. A, Mean (±SEM) values of ΔG (top), nV (middle), and OI (bottom) observed in a group of control MNCs exposed to a +60 mosmol · kg−1 hypertonic stimulus (gray bar). B, Effect of the same hypertonic stimulus on a group of MNCs exposed to Ang II (same layout as in A). C, Bar graph plotting the mean (±SEM) values of MI and OI measured in MNCs under control conditions (open bars) and in the presence of Ang II (filled bars). *p < 0.05. n.s. indicates that the values are not significantly different. D, Plots superimposing all of the mean (±SEM) values of ΔG and corresponding nΔV observed in cells stimulated using negative pressure (circles) or osmotic pressure (squares) in the absence (open symbols) or presence (filled symbols) of Ang II. The lines show regression fits through the four data sets.

