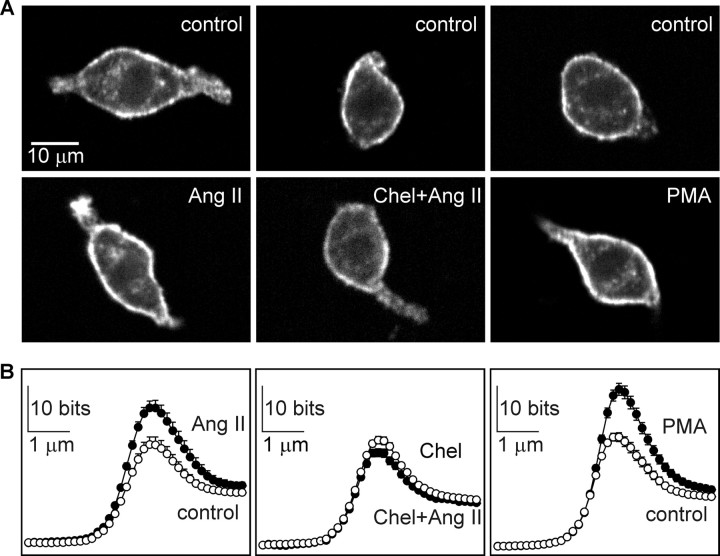
Figure 6.
Ang II induces PKC-dependent increase in cortical F-actin density. A, Confocal images showing F-actin intensity in MNCs stained with Texas Red-labeled phalloidin. The top panels show examples of cells incubated under control conditions for the treatments shown in the bottom panels. The bottom panels show examples of MNCs exposed to 1 μm Ang II for 5 min (left), Ang II and chelerythrine (Chel+Ang II; middle panel), or PMA (right). B, Line scan plots showing mean (±SEM) values of fluorescence (F-actin density; in bits) at the perimeter of cells exposed to the corresponding treatments shown in A. Note that significant differences are only observed in the ∼2 μm region that lies at the perimeter of the cells.

