
Figure 4.
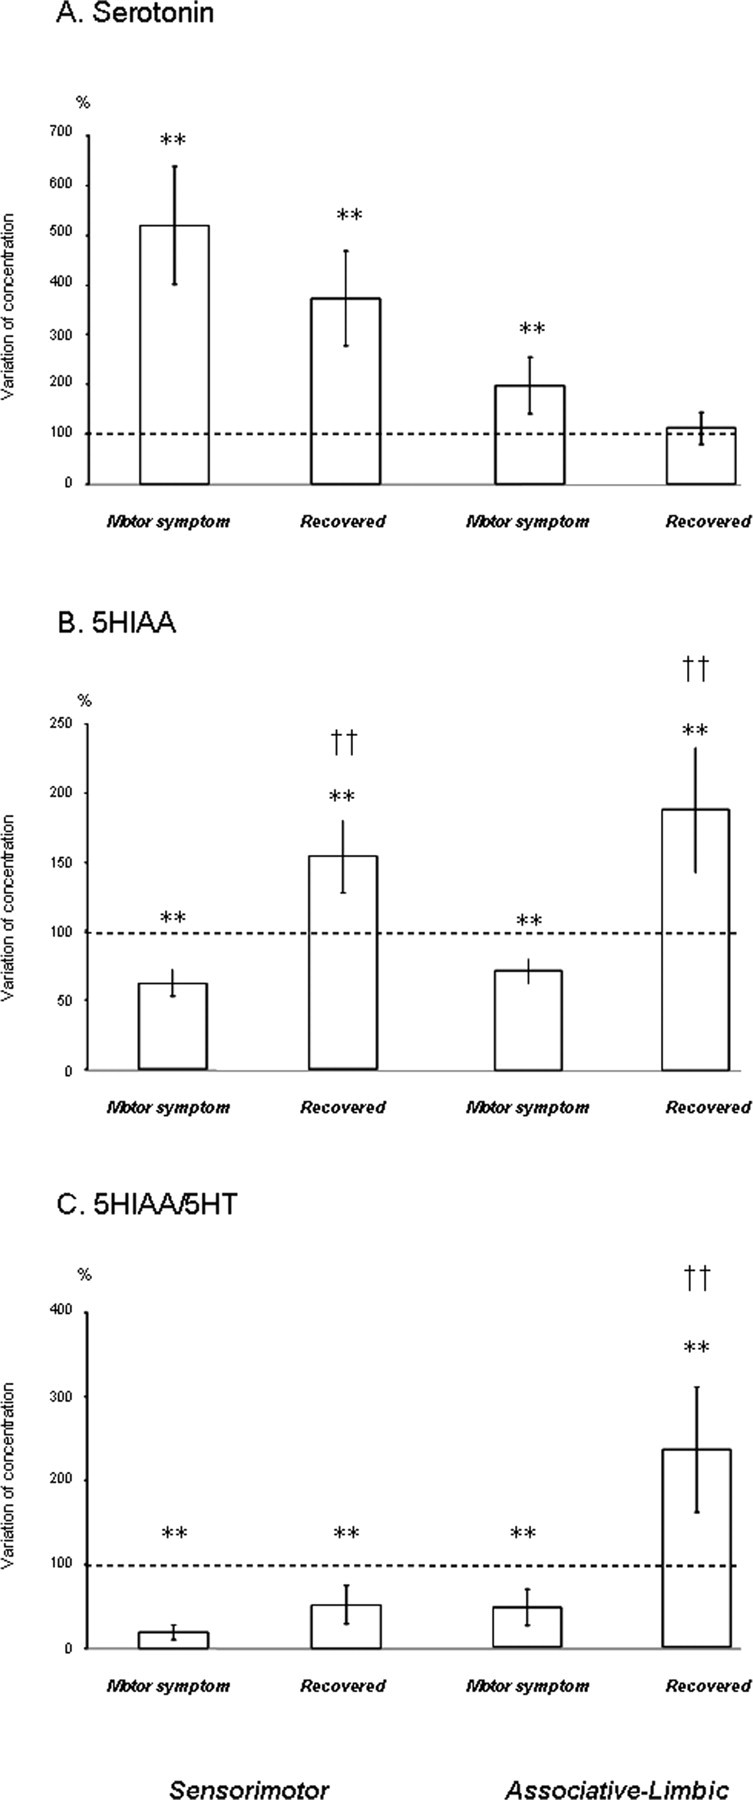
A–C, Schematic representation of serotonin (A) and 5HIAA (B) concentrations and 5HIAA/5-HT ratio (C) in sensorimotor and associative-limbic striatal territories during the normal, symptomatic, and recovery states. Results for the five monkeys (mean ± SEM) are shown for the motor symptom and recovery states, represented by a vertical bar. All concentrations are expressed as a percentage of basal levels (set at 100%) which are represented by a dotted line. **p < 0.01 versus the normal state; ††p < 0.01 versus the motor symptom state.