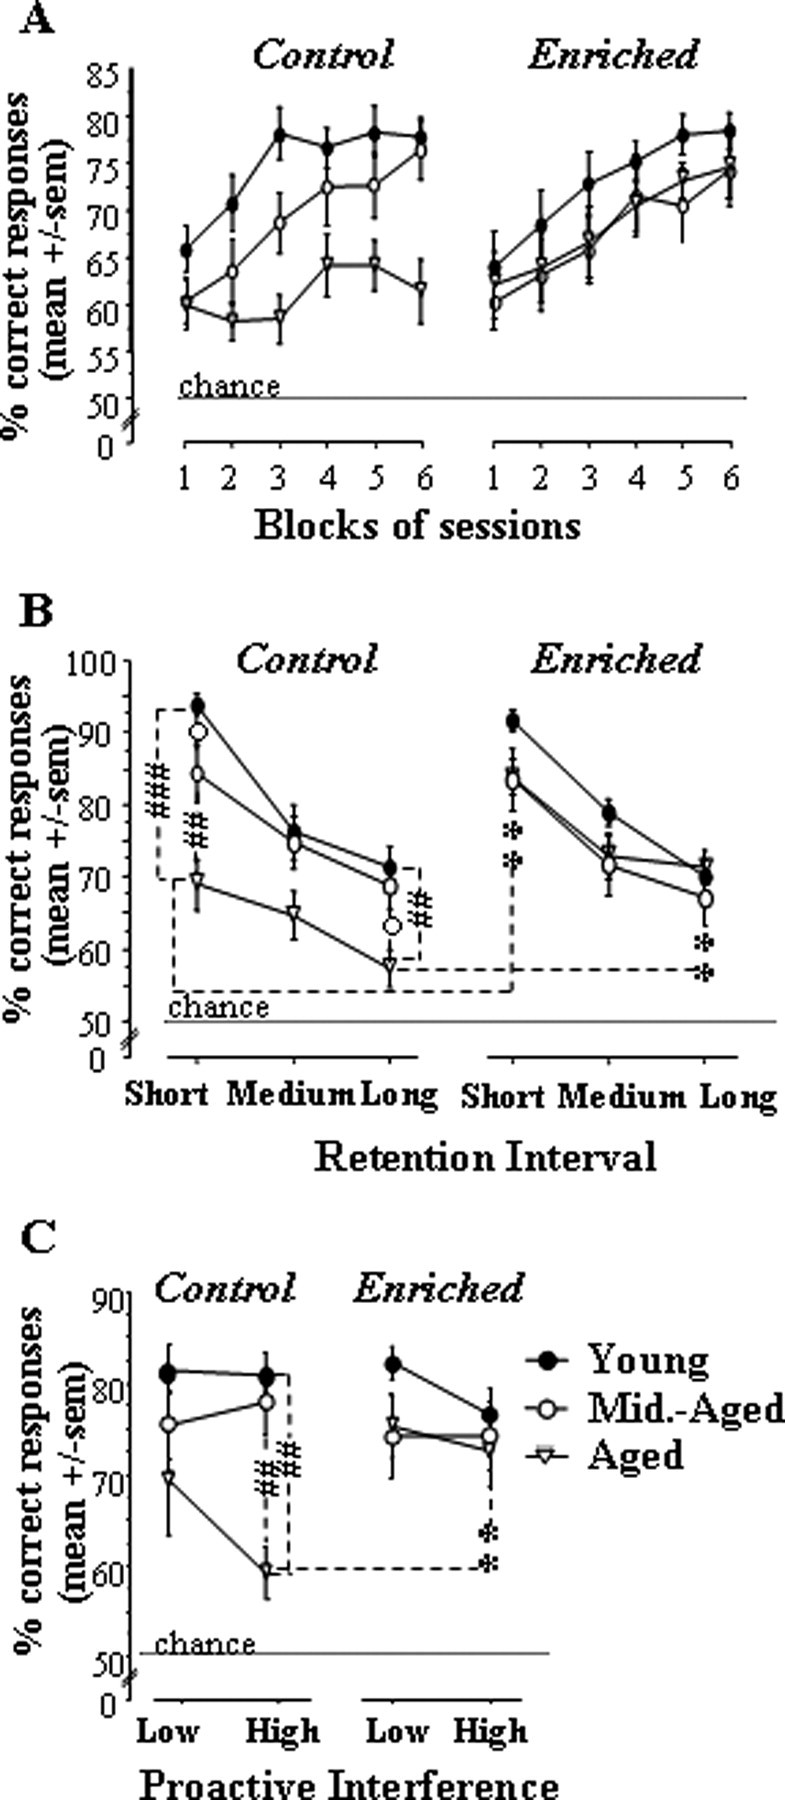
Figure 4.

Performance in the STWM task for each age group in control and vitamin A-enriched conditions in experiment 2A. A–C, Performance across blocks of sessions (A), as a function of retention interval (short, medium, and long; B) and proactive interference levels (low and high; C). Comparison of two age groups in the same nutritional condition, #p < 0.05, ##p < 0.01, ###p < 0.001. Comparison of two diet groups of the same age, **p < 0.01.
