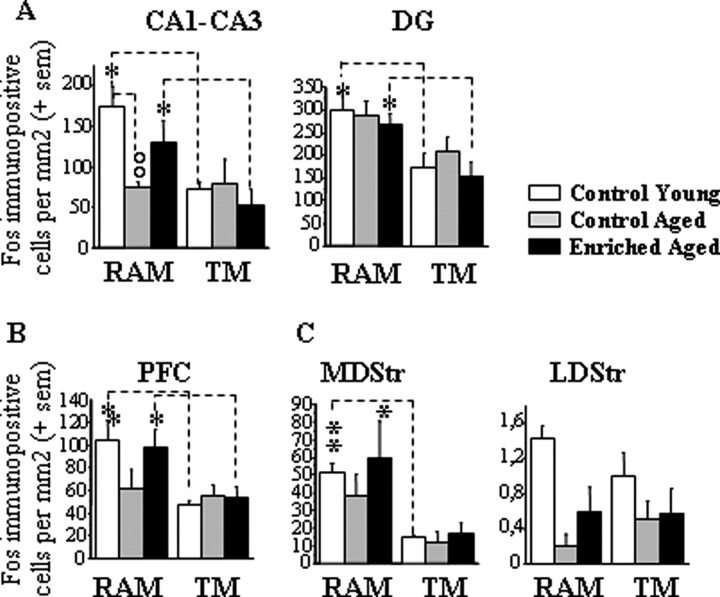
Figure 6.
Quantitative measurements of Fos protein for young and aged groups in control and vitamin A-enriched diet conditions in experiment 3A. A–C, Results are expressed as mean number of Fos-immunopositive cells per square millimeter (±SEM) in the hippocampus (CA1, CA3, and DG; A), PFC (B), and dorsal striatum (lateral and medial parts; C). Comparison of two age groups of the same behavioral condition, °°p < 0.01. Comparison between RAM and TM groups of the same age, *p < 0.05, **p < 0.001.

