
Figure 3.
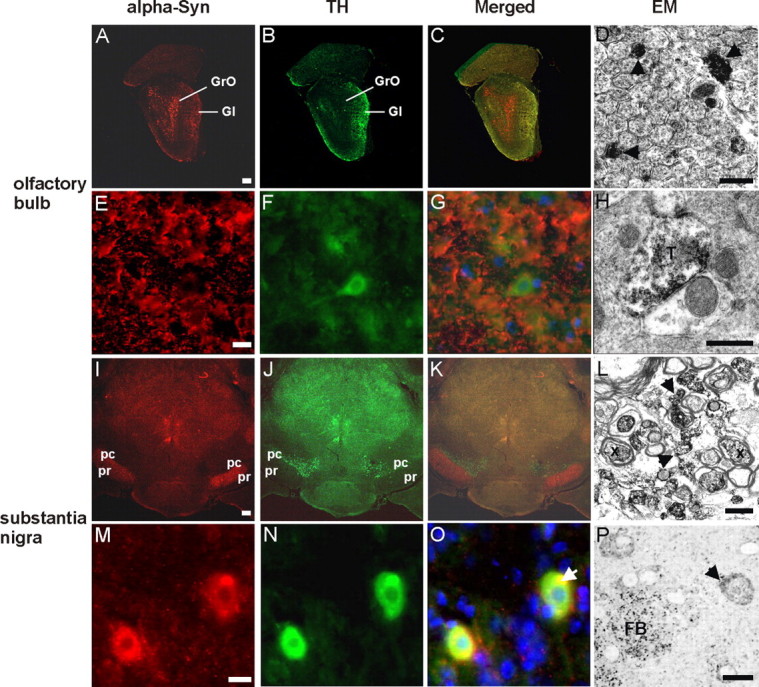
Confocal images of α-syn and TH double-staining immunofluorescence and electron microscopy of α-syn expression in the olfactory bulb and the substantia nigra. Frontal brain sections of 20-month-old CaM_α-syn mice were double-labeled against α-syn (red) and TH (green) to detect transgene expression in dopaminergic structures of the olfactory bulb (A–H) and substantia nigra (I–P). A, α-syn staining was detected in the granular (GrO) and, to a minor extent, in the glomerular layer (Gl) of the olfactory bulb; the latter contains also TH-positive structures (B). C, Merged image shows a partial overlap of α-syn expression and TH in the Gl. E, F, Higher magnification of the Gl revealed prominent punctate α-syn immunostaining of the neuropil (arrows) (E) and TH immunoreaction also in neuronal somata (F). G, Merged image shows no colocalization of α-syn and TH-positive neurons, but a moderate colocalization in the neuropil. D, H, Electron microscopy of the Gl confirmed α-syn accumulation in the neuropil localized in unmyelinated axons (D, arrows) and synaptic terminals (T) (H). I, In the SN, α-syn was most prominent in the pars reticulata (pr) and less expressed in the pars compacta (pc), which is comprised of TH-positive cells (J). K, Merged image illustrated overlapping of α-syn and TH staining in the intersectional area between pc and pr. M, Higher magnification of this area detected α-syn in neuronal somata with accumulations varying in size, in some cases being colocalized with TH (N) as clearly identified in the merged image (O, arrow). L, Electron microscopy of the intersectional area revealed α-syn in myelinated (X) and unmyelinated (arrows) axons. P, Semithin section confirmed different accumulation sizes of α-syn in neuronal somata (arrow) and in fiber bundles (FB). Scale bar: A–C, I–K, 1 mm; E–G, M–O, 100 μm; D, H, L, 500 nm; P, 1 μm.