
Figure 5.
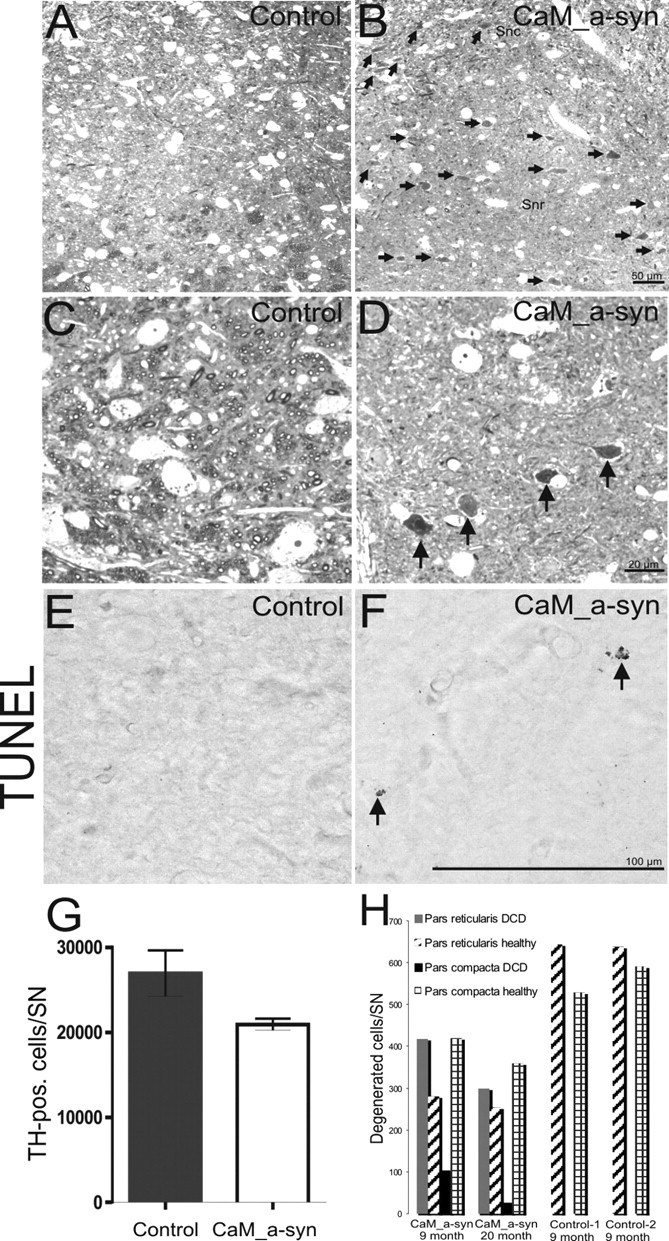
Nigral cell death in CaM_α-syn mice. A, B, Toluidine blue-stained sections of a 9-month-old control mouse (A) and a CaM_α-syn littermate (B) showed numerous dark cells (arrows) in the pars reticulata (SNr) in the tg α-syn mouse that were absent in the control. Various dark cells were also distributed among healthy neurons in the pars compacta (SNc). C, D, Higher enlarged pictures of the pars reticulata of the control showed the large lightly stained healthy neurons (C) and the shrunken dark degenerated cells (arrows) in the respective area of the CaM α-syn mouse (D). F, Single apoptotic cells (arrows) were detected in CaM_α-syn mice, were absent in control mice (E). G, Graph showing stereological counting of TH-positive SN neurons revealed a strong tendency of reduction, bordering significant level (p = 0.07). Error bars indicate SEM. H, Counting of dark cells in two CaM α-syn mice revealed a high amount of dark cells (DCD) in the substantia nigra pars reticulata and a minor amount of dark cells in the pars compacta. In both controls, dark cells were missing.