Figure 1.
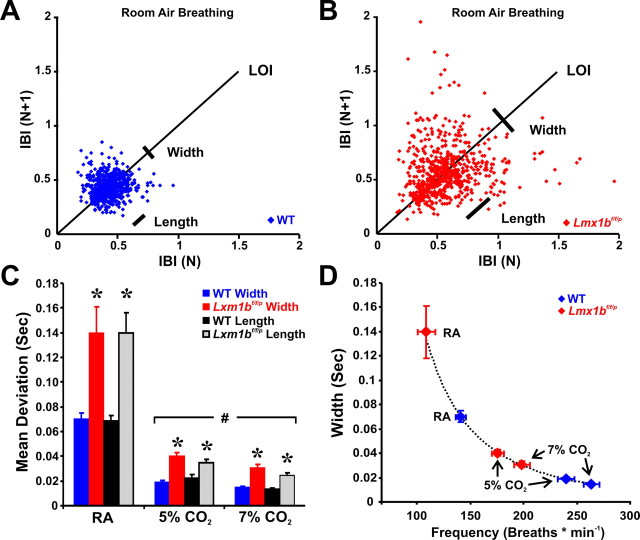
Breath-to-breath variability in WT and Lmx1bf/f/p mice. A, B, Poincaré plot of the IBI of sequential breaths during baseline normoxic ventilation in WT (A; n = 7) and Lmx1bf/f/p (B; n = 7) mice. C, Mean width (short-term variation) and length (long-term variation) in room air (RA), 5% and 7% CO2. D, Relationship of scatter plot width and breathing frequency in WT mice under varying conditions. Note that Lmx1bf/f/p data fall along the line fit to the WT data (variability = 14,660 × frequency−2.4754), indicating the variation in IBI was caused by differences in breathing frequency rather than breathing instability. Unpaired t test was used; *p < 0.05 for WT versus Lmx1bf/f/p; #p < 0.05 for RA versus 5% or 7% CO2. Data are mean ± SEM.

