
Figure 1.
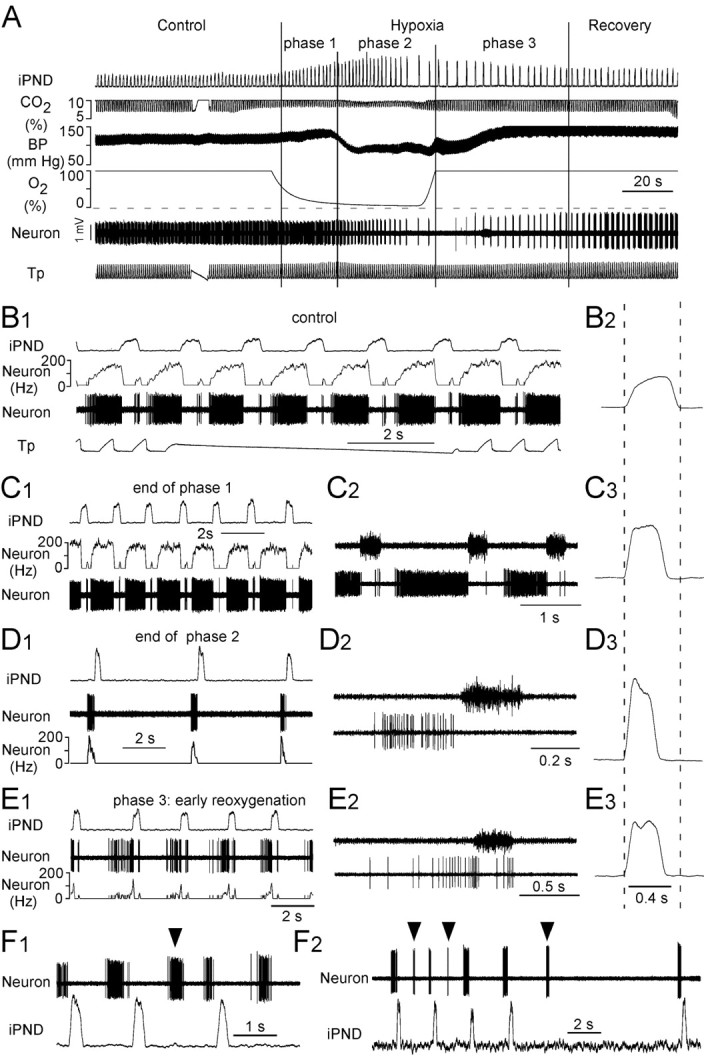
Bötzinger E-AUG neurons become pre-I under hypoxia. A, Experimental design. The three phases of the hypoxic response are indicated by vertical bars. The interruption in the tracheal pressure trace (Tp) and the end-expiratory CO2 trace (CO2) identifies a brief period during which the respirator was switched off. B1, Discharge pattern of the neuron shown in A during the control period. Note the E-AUG pattern and the small rebound at the end of inspiration. B2, Computer average of iPND during the control period; note the incremental pattern. C1, Same cell during the first phase of hypoxia. The cell discharges earlier during expiration and rapidly reaches a plateau discharge. C2, PND and unit at expanded scale. C3, Averaged iPND. Note the shortened but still slightly incrementing pattern. D1, Cell during late phase 2 (gasping). Note the brief but intense preinspiratory bursts. D2, Expanded scale view of the PND and the preinspiratory discharge of the cell. D3, Averaged iPND (average of 5 phrenic bursts). The burst is short and strongly decrementing. E1, Same cell during phase 3. Note the paired pre-I and post-I bursts. E2, Expanded scale view of PND and the double discharge of the cell during phase 3. E3, Averaged iPND during phase 3 (average of 8 bursts). F1, F2, Two examples of pre-I neurons with ectopic bursting during late phase 2.