
Figure 5.
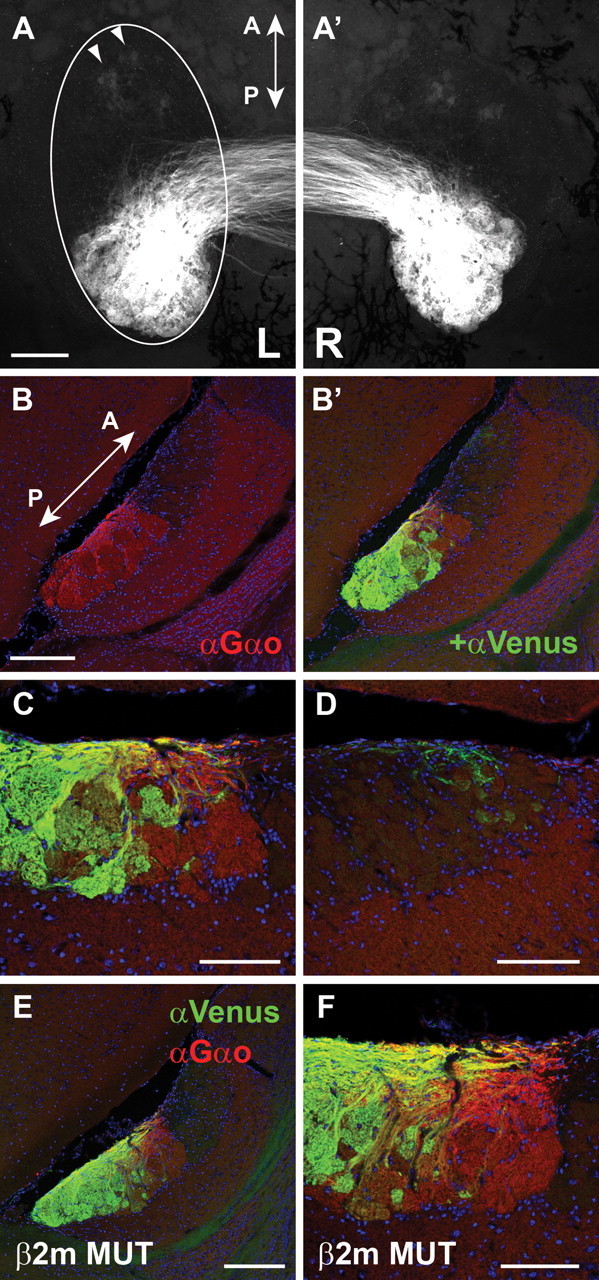
Axonal projections of M10.2–Venus+ VSNs to the AOB. (A, A′) Whole-mount dorsal view of the AOB shows major axonal projections to the pAOB with minor projections to the aAOB (arrowheads), in an M10.2–Venus homozygous mouse. Left and right AOBs are shown in A and A′, respectively. B, B′, IHC in an M10.2–Venus homozygous mouse. A sagittal section of the AOB was stained with anti-Gαo (red) and anti-Venus (green) antibodies. The Venus signal localizes the most posterior two-thirds of the pAOB, and weak signals are also observed in the most anterior region of the aAOB. C, Higher-magnification view of the middle area of the AOB in B. D, Higher-magnification view of the aAOB in B. Weak signals of diffusely projecting axons are observed. E, F, IHC with anti-Gαo and anti-Venus antibodies on sagittal sections of the AOB from a β2-microglobulin mutant mouse in an M10.2–Venus heterozygous background. No obvious difference is observed compared the higher-magnification views of the β2-microglobulin mutant mouse in F with the wild-type mouse in C. Sections were counterstained with TOTO-3 to visualize nuclei in B–F. Mice are 10–12 weeks old. A, Anterior; P, posterior. Scale bars: A, B, E, 200 μm; C, D, F, 100 μm.