Figure 5.
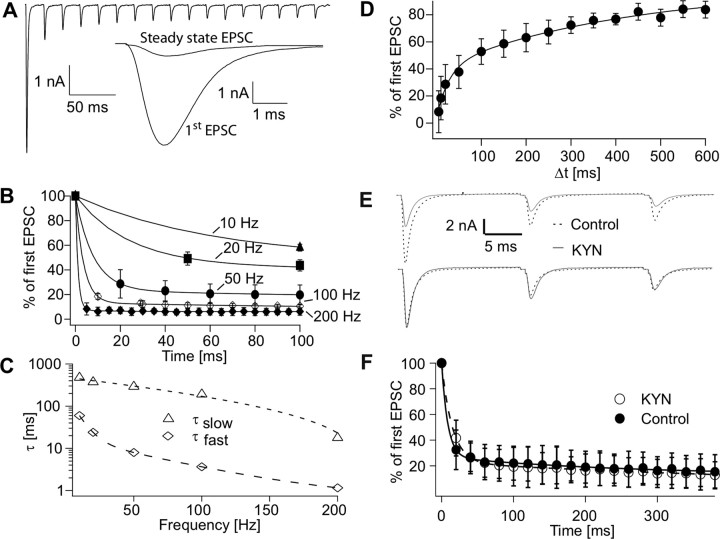
STD at the giant synapse. A, Postsynaptic currents elicited by 50 Hz stimulation (20 APs, stimulus artifact removed). B, STD at different stimulation frequencies. Normalized data taken from eight neurons. The data could be described with a double-exponential function fitted to 20 data points (line) yielding frequency-dependent time constants. Only the first 100 ms are shown for clarity. C, Time constants of STD at different stimulation frequencies obtained from data shown in B. D, Time course of recovery from STD (fast component, 27 ms; slow component, 423 ms; n = 9). E, Example of EPSCs evoked by stimulating the giant terminal at 50 Hz in normal bath solution (dashed black line) and in the presence of 1 mm kynurenic acid (KYN; solid gray line). The bottom shows EPSCs normalized to the first peak amplitude to evaluate the time course of depression. F, Amplitudes normalized to the first EPSC are shown in the presence of KYN (gray open circle) and in standard ringer solution (control, black filled circle). Data could be described with double exponential functions (KYN, dashed gray line, control solid black line). Data were obtained from four independent experiments.

