
Figure 7.
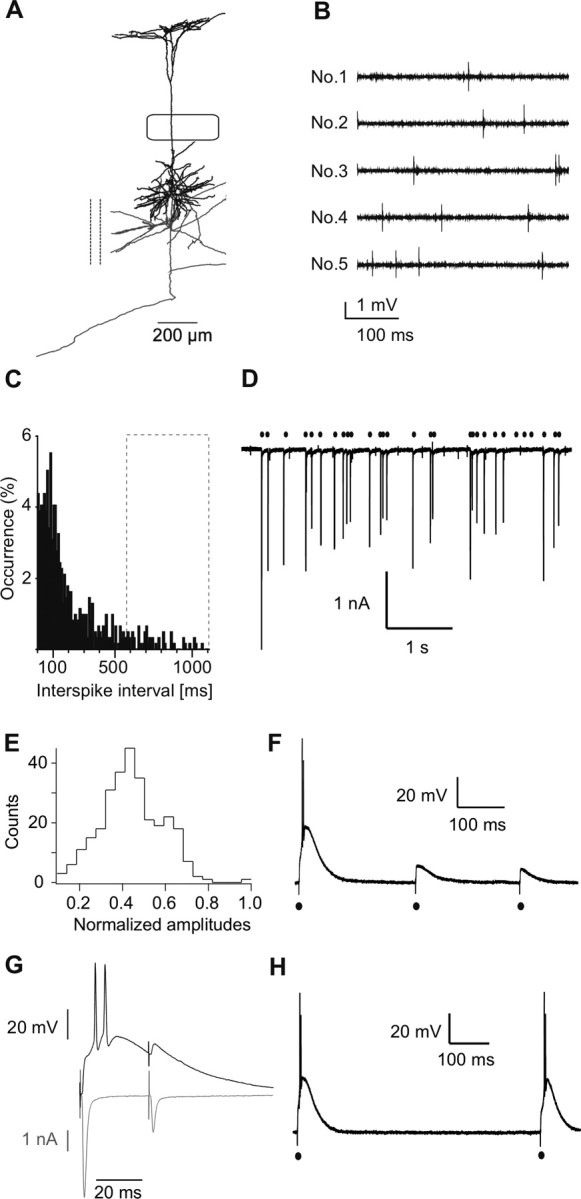
Low-pass filtering of cortical AP patterns. A, Cortical L5B neuron filled with biocytin during in vivo recordings and reconstructed with Neurolucida (MicroBrightField). Axon (gray), cortical collaterals cut (dashed line), box symbolizes D2 barrel borders. This cell is used as an example, the complete data set is published in the study by de Kock et al. (2007). B, Spontaneous APs recorded juxtasomally in vivo from the L5B neuron shown in A. Different epochs (No.1–No.5) from the same recording are shown. In vivo patterns used to stimulate L5B terminals were derived from these data. C, Interspike-interval histograms of spontaneous activity. D, In vitro recording of EPSCs in a POm neuron evoked by stimulation of the L5B terminal with spontaneous in vivo patterns shown in B. Similar results were obtained in three independent recordings. E, Distribution of EPSC amplitudes (from D) normalized to the first EPSC (−3.47 nA). The mean amplitude (−1.54 ± 0.49 nA) was 45% of first EPSC. Data were obtained from three independent recordings. F, Example of voltage responses to in vivo stimulus pattern (only first three stimuli). Episodes of 20 stimuli were applied in each of 11 independent recordings. V m = −72 mV. G, Alternating current and voltage recording of responses to a paired pulse (Δ = 30 ms) in the same neuron. Similar recordings were obtained in three independent experiments. H, Example of double-pulse stimulation with an ISI of 700 ms. This was the shortest interval evoking two subsequent AP bursts in this example. V m = −72 mV. Similar recordings were obtained in four independent experiments.